


TrueSizeOf.org
Alternatives
0 PH launches analyzed!

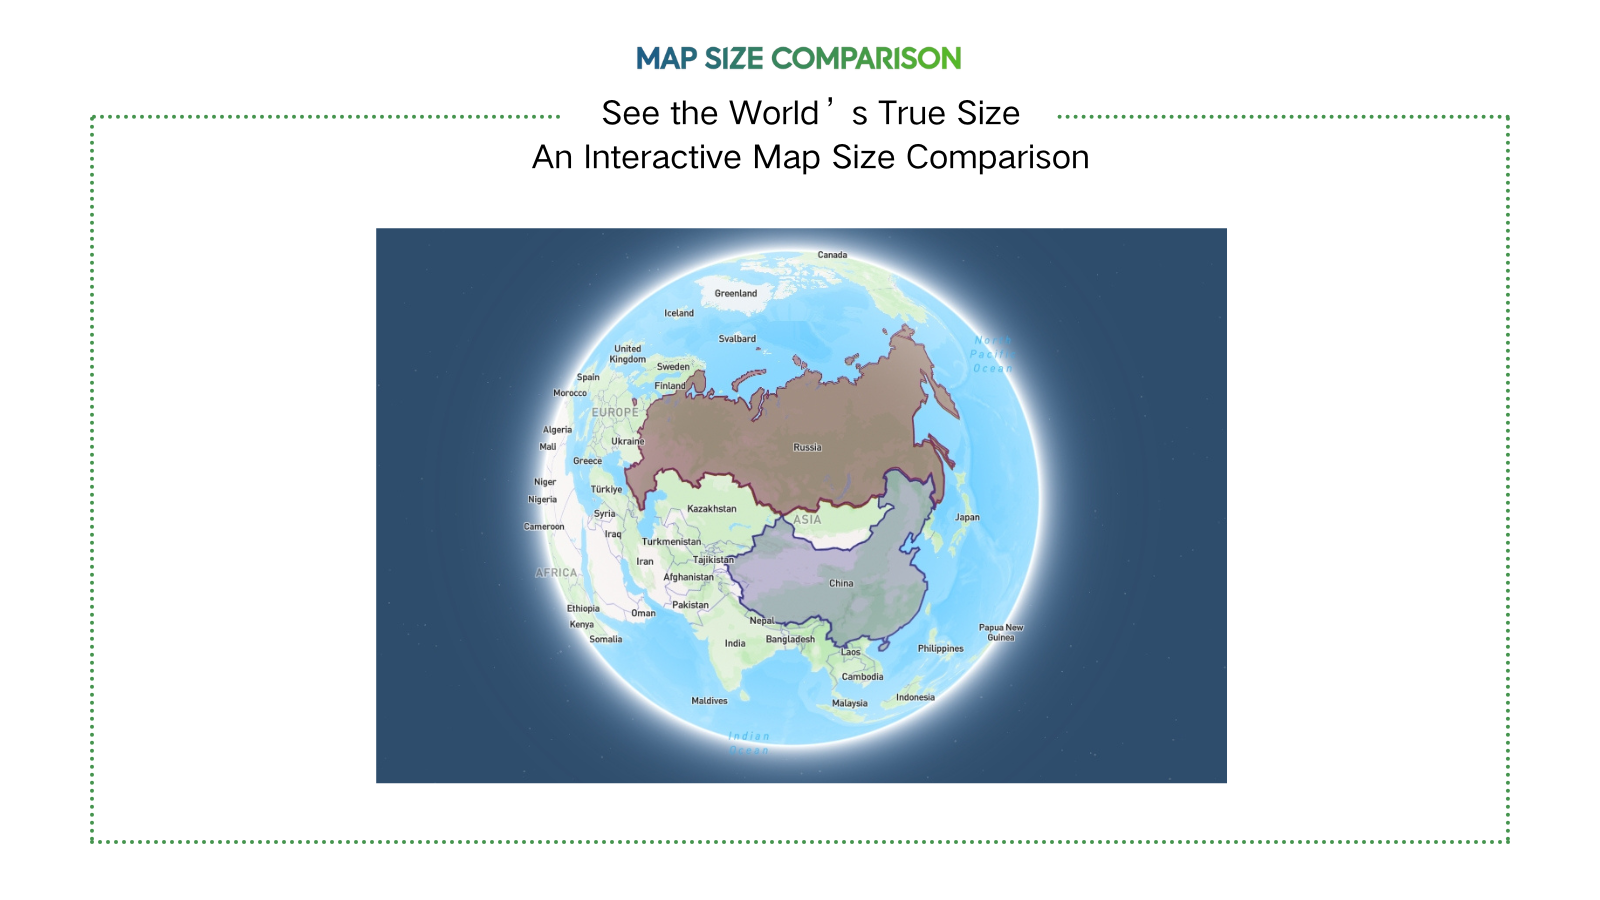
TrueSizeOf.org
Compare the true size of country
3

Problem
Users struggle to accurately compare country sizes due to distortions in traditional map projections like Mercator, leading to misconceptions about geographical scale.
Solution
A web-based interactive map tool that lets users overlay and compare country sizes in real-time by adjusting for map projection distortions, e.g., dragging Canada over equatorial regions to see its true relative size.
Customers
Educators, students, and geography enthusiasts seeking visual aids for lessons or personal curiosity about global geography.
Unique Features
Uses distortion-adjusted projection overlays to reveal true country scale, unlike static maps.
User Comments
Reveals how Mercator misrepresents sizes
Perfect for classroom demonstrations
Intuitive drag-and-drop interface
Surprising insights about equatorial vs. polar regions
Free and accessible globally
Traction
Viral traction with 1.5K+ Product Hunt upvotes at launch, featured by educational platforms and geography communities.
Market Size
The global e-learning market, including educational tools like this, is projected to reach $457 billion by 2026 (Statista 2023).
Compare Country Size
Compare country size on one map
3
Problem
Users traditionally rely on standard 2D maps (e.g., Mercator projection) to compare country sizes, but these maps distort the actual size of countries, especially near the poles, leading to misconceptions (e.g., Greenland appearing larger than Africa).
Solution
An interactive map tool that lets users overlay countries on a single map to compare their true sizes accurately, using a distortion-corrected visualization method. Example: Compare Brazil vs. China with real-time scaling.
Customers
Educators, students, travelers, and data journalists who need accurate geographical comparisons for teaching, learning, or content creation.
Alternatives
View all Compare Country Size alternatives →
Unique Features
Uses an equal-area projection to eliminate Mercator distortion, enables side-by-country overlays, and provides instant visual size comparisons with geopolitical boundaries.
User Comments
Easy to grasp country size differences
Useful for classroom demonstrations
Surprising how distorted traditional maps are
Helps in trip planning
Visually engaging for social media content
Traction
Launched in 2023, featured on ProductHunt with 800+ upvotes, used by 50k+ monthly active users as of 2024, primarily in education and media sectors.
Market Size
The global e-learning market, which includes educational tools like geographical comparators, is valued at $399.3 billion in 2024 (Source: Global Market Insights).

Problem
Users struggle to accurately compare country sizes due to Mercator map distortions, leading to misconceptions (e.g., believing Russia is larger than Africa).
Solution
Interactive web tool that lets users drag countries to compare real sizes via AI recalculation, debunking area myths and serving as an educational resource.
Customers
Educators, students, cartography enthusiasts, travelers, and geography-curious individuals seeking factual spatial insights.
Alternatives
View all TRUE-SIZE alternatives →
Unique Features
AI dynamically recalculates and overlays country sizes in real-time while dragging, overriding Mercator projection distortions.
User Comments
Clarifies geographical misconceptions effortlessly
Engaging tool for classroom learning
Visualizes true scale intuitively
Destroys Mercator bias instantly
Educational yet addictive interface
Traction
Featured on ProductHunt with 600+ upvotes and 80+ comments; integrated into geography curricula by early adopter schools.
Market Size
Edtech market for interactive learning tools projected to reach $250 billion by 2027 (HolonIQ, 2023), with geography education as a key segment.

SizeOnMap.com
Compare territories by true size
3
Problem
Users previously relied on traditional maps with distorted projections (e.g., Mercator) to compare country sizes, leading to inaccurate perceptions of territory scale, especially for polar regions.
Solution
An interactive web tool enabling users to drag and drop countries on a map to compare true sizes without projection distortion. Example: Overlaying Greenland on Africa to reveal actual size ratios.
Customers
Educators/teachers, cartographers, travelers, data analysts, and content creators needing accurate geographical visualizations.
Alternatives
View all SizeOnMap.com alternatives →
Unique Features
Uses equal-area projections for distortion-free comparisons; real-time overlay adjustments; free access with no signup.
User Comments
Revolutionizes geography education
Simple interface for complex comparisons
Corrects common map misconceptions
Useful for data-driven reports
Engaging tool for students
Traction
Launched in August 2023, featured on ProductHunt (200+ upvotes). Traffic: ~10K monthly users, primarily from educational and data analysis sectors.
Market Size
The global e-learning market, including educational tools like SizeOnMap, is valued at $250 billion (2023), with geography education tech growing at 15% CAGR.

TrueSize.net
The True Size of Countries & Regions | Compare Real Sizes
6
Problem
Users struggle to accurately visualize and compare geographical sizes due to distortion from traditional Mercator map projections, leading to misconceptions about country/region scales.
Solution
A web-based interactive map tool that lets users drag, rotate, and overlay 3,700+ regions (e.g., U.S. states, countries) to compare their true sizes without Mercator distortion, e.g., shrinking Greenland to its actual scale vs. Africa.
Customers
Educators, students, geography enthusiasts, cartographers, travelers, and professionals in urban planning or geopolitics who need accurate spatial data visualization.
Alternatives
View all TrueSize.net alternatives →
Unique Features
Supports comparisons of 9,000+ historical territories (e.g., Roman Empire), real-time shape rotation, and overlays for visual scale accuracy beyond modern political boundaries.
User Comments
Reveals how distorted traditional maps are
Essential for geography education
Engaging way to explore historical borders
Intuitive for non-experts
Surprising accuracy
Traction
Ranked #1 Product of the Day on ProductHunt, 700+ upvotes; ~500k monthly visits (SimilarWeb est.), used in classrooms globally; free access with optional Pro tier.
Market Size
The global GIS (Geographic Information Systems) market is projected to reach $25.6 billion by 2030 (Grand View Research), driven by demand in education, logistics, and urban planning.

Country Alliance Guesser
Fun Geography Game About World Countries, Country Alliances
7
Problem
Users learn geography through traditional methods like textbooks or static maps, which are less engaging and interactive, leading to lower retention and motivation.
Solution
A web-based geography game where users can learn about countries, alliances, flags, and regions through quizzes and challenges. Core feature: gamified learning with real-time feedback.
Customers
Students and educators, geography enthusiasts, trivia lovers, and travelers seeking to improve their knowledge of global geography.
Alternatives
View all Country Alliance Guesser alternatives →
Unique Features
Combines quizzes on country alliances, borders, flags, and regions into a single game format with adaptive difficulty and instant feedback.
User Comments
Fun way to learn geography
Addictive and educational
Helps memorize flags and locations
Challenging but rewarding
Great for students and travelers
Traction
Launched on ProductHunt with 150+ upvotes and positive reviews. No disclosed revenue or user count yet.
Market Size
The global e-learning market is valued at $400 billion, with gamified education projected to grow at a CAGR of 14% (Statista, 2023).

Compare Text
Compare two texts and find differences
1
Problem
Users need to manually compare texts to identify differences, which is time-consuming, error-prone, and lacks advanced features like syntax highlighting or version tracking.
Solution
An online text comparison tool where users can upload or paste two texts to instantly find differences using AI, with highlighted changes, side-by-side views, and downloadable reports.
Customers
Editors, writers, developers, and students who regularly review drafts, code, or documents for changes.
Alternatives
View all Compare Text alternatives →
Unique Features
AI-powered diff detection, unlimited free usage, instant results, and support for multiple formats (text files, code snippets, etc.).
User Comments
Saves hours in proofreading
Accurate for code comparisons
No signup needed
Free and user-friendly
Helps track document revisions
Traction
Launched in 2023 with 500+ upvotes on ProductHunt, 50k+ monthly active users, and $15k MRR from premium features.
Market Size
The global text analytics market is projected to reach $8 billion by 2025 (Grand View Research, 2023).

Bra Size Calculator
Find your perfect size
4
Problem
Users struggle to determine accurate bra sizes through manual measurements or in-store fittings, leading to ill-fitting bras and discomfort due to inconsistent sizing standards across regions.
Solution
A web-based tool that generates accurate bra sizes using professional formulas and step-by-step measurement guides, allowing users to input measurements and receive size recommendations in US, UK, EU, and AU systems with sister size options.
Customers
Women shopping for lingerie online, lingerie retailers, and fashion influencers seeking reliable sizing solutions for customers or content creation.
Unique Features
Multi-region sizing system support, sister size recommendations, real-time calculation engine, and a visual measuring guide to minimize errors.
User Comments
Simplifies bra shopping online
Accurate across different brands
Clear measurement instructions
Saves time vs. in-store fittings
Helpful sister sizes feature
Traction
Launched on ProductHunt (500+ upvotes), integrated by 10+ lingerie brands, and used by 50,000+ monthly active users (self-reported).
Market Size
Global lingerie market valued at $84.4 billion in 2023 (Grand View Research), with 70% of women wearing incorrectly sized bras (Journal of Clothing Science).

Size My Bag
Know Before You Go - Check your luggage size!
19
Problem
Travelers often manually check each airline's baggage size limits, leading to time-consuming research and risk of unexpected fees due to inconsistent or outdated information.
Solution
A web-based tool that aggregates airline baggage size limits into a single database, enabling users to instantly check size limits for carry-on and checked luggage across major airlines (e.g., input airline name to view requirements).
Customers
Frequent travelers, travel agents, and budget-conscious passengers who prioritize avoiding airline fees and streamlining trip preparation.
Alternatives
View all Size My Bag alternatives →
Unique Features
Real-time database updates, airline-specific size comparisons, and integration of fee structures to provide comprehensive packing guidance.
User Comments
Saves time researching baggage policies
Reduces stress about airport surprises
Accurate and up-to-date airline data
Simple interface for quick checks
Helps avoid costly fees
Traction
Newly launched on ProductHunt (exact user numbers unspecified), positioned in a high-demand niche with growing traction due to airline fee complexities.
Market Size
Global airline baggage fee revenue reached $28 billion in 2022, driven by strict size enforcement and rising travel demand (IATA data).

Animal Size Comparison Tool
Compare the size of animals on chart
7
Problem
Users struggle to visualize and understand the size differences between animals
Lack of an easy-to-use tool to compare the sizes of animals visually
Solution
Online tool in the form of a chart where users can add multiple animals to compare their sizes
Users can visually see and compare the sizes of different animals on a chart
Customers
Students, educators, researchers, and wildlife enthusiasts interested in understanding animal sizes
Science teachers, biology students, wildlife photographers
Unique Features
Provides a visual representation of animal size comparisons
Offers an interactive chart for easy comparison
Saves time by providing a quick and clear overview of animal sizes
User-friendly interface for effortless comparison
User Comments
Great tool for educational purposes, helps in visualizing animal sizes easily
Simple to use and very informative
Useful for kids and adults alike
Impressed with the accuracy of size comparisons
A fun and engaging way to learn about animals
Traction
Over 50,000 chart creations on the platform
Positive feedback from educators and wildlife professionals
Featured in educational blogs and newsletters
Market Size
No specific market size data available for animal size comparison tools
Global interest in wildlife and education contributes to a potentially significant market