


TrueSize.net
Alternatives
0 PH launches analyzed!

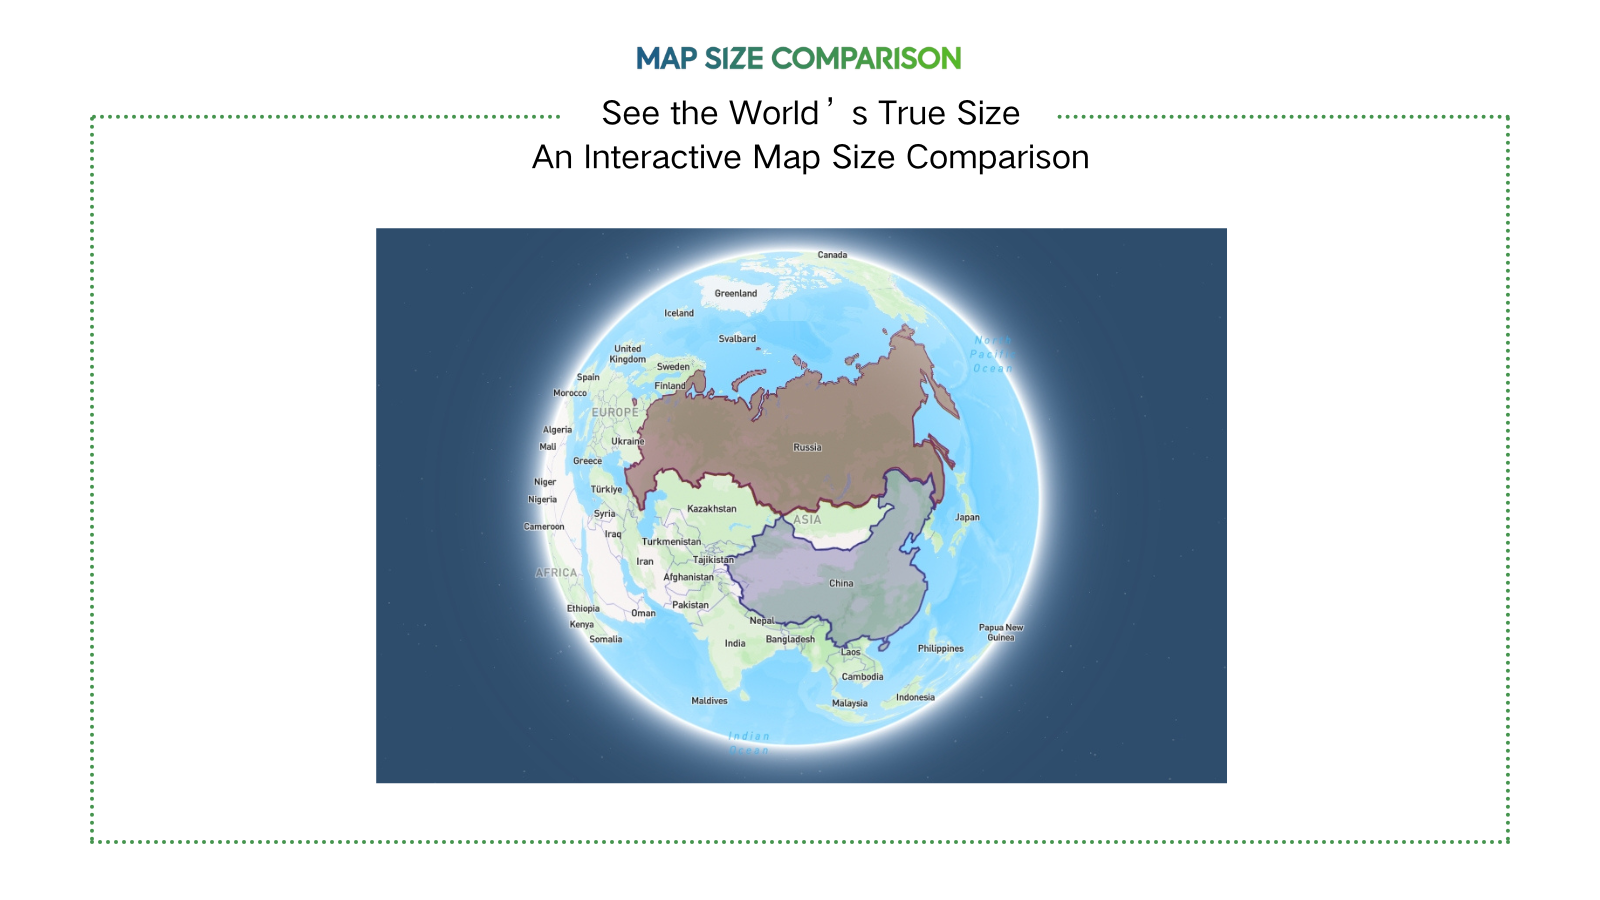
TrueSize.net
The True Size of Countries & Regions | Compare Real Sizes
6

Problem
Users struggle to accurately visualize and compare geographical sizes due to distortion from traditional Mercator map projections, leading to misconceptions about country/region scales.
Solution
A web-based interactive map tool that lets users drag, rotate, and overlay 3,700+ regions (e.g., U.S. states, countries) to compare their true sizes without Mercator distortion, e.g., shrinking Greenland to its actual scale vs. Africa.
Customers
Educators, students, geography enthusiasts, cartographers, travelers, and professionals in urban planning or geopolitics who need accurate spatial data visualization.
Unique Features
Supports comparisons of 9,000+ historical territories (e.g., Roman Empire), real-time shape rotation, and overlays for visual scale accuracy beyond modern political boundaries.
User Comments
Reveals how distorted traditional maps are
Essential for geography education
Engaging way to explore historical borders
Intuitive for non-experts
Surprising accuracy
Traction
Ranked #1 Product of the Day on ProductHunt, 700+ upvotes; ~500k monthly visits (SimilarWeb est.), used in classrooms globally; free access with optional Pro tier.
Market Size
The global GIS (Geographic Information Systems) market is projected to reach $25.6 billion by 2030 (Grand View Research), driven by demand in education, logistics, and urban planning.
Compare Country Size
Compare country size on one map
3
Problem
Users traditionally rely on standard 2D maps (e.g., Mercator projection) to compare country sizes, but these maps distort the actual size of countries, especially near the poles, leading to misconceptions (e.g., Greenland appearing larger than Africa).
Solution
An interactive map tool that lets users overlay countries on a single map to compare their true sizes accurately, using a distortion-corrected visualization method. Example: Compare Brazil vs. China with real-time scaling.
Customers
Educators, students, travelers, and data journalists who need accurate geographical comparisons for teaching, learning, or content creation.
Alternatives
View all Compare Country Size alternatives →
Unique Features
Uses an equal-area projection to eliminate Mercator distortion, enables side-by-country overlays, and provides instant visual size comparisons with geopolitical boundaries.
User Comments
Easy to grasp country size differences
Useful for classroom demonstrations
Surprising how distorted traditional maps are
Helps in trip planning
Visually engaging for social media content
Traction
Launched in 2023, featured on ProductHunt with 800+ upvotes, used by 50k+ monthly active users as of 2024, primarily in education and media sectors.
Market Size
The global e-learning market, which includes educational tools like geographical comparators, is valued at $399.3 billion in 2024 (Source: Global Market Insights).

Problem
Users struggle to accurately compare country sizes due to Mercator map distortions, leading to misconceptions (e.g., believing Russia is larger than Africa).
Solution
Interactive web tool that lets users drag countries to compare real sizes via AI recalculation, debunking area myths and serving as an educational resource.
Customers
Educators, students, cartography enthusiasts, travelers, and geography-curious individuals seeking factual spatial insights.
Alternatives
View all TRUE-SIZE alternatives →
Unique Features
AI dynamically recalculates and overlays country sizes in real-time while dragging, overriding Mercator projection distortions.
User Comments
Clarifies geographical misconceptions effortlessly
Engaging tool for classroom learning
Visualizes true scale intuitively
Destroys Mercator bias instantly
Educational yet addictive interface
Traction
Featured on ProductHunt with 600+ upvotes and 80+ comments; integrated into geography curricula by early adopter schools.
Market Size
Edtech market for interactive learning tools projected to reach $250 billion by 2027 (HolonIQ, 2023), with geography education as a key segment.

TrueSizeOf.org
Compare the true size of country
3
Problem
Users struggle to accurately compare country sizes due to distortions in traditional map projections like Mercator, leading to misconceptions about geographical scale.
Solution
A web-based interactive map tool that lets users overlay and compare country sizes in real-time by adjusting for map projection distortions, e.g., dragging Canada over equatorial regions to see its true relative size.
Customers
Educators, students, and geography enthusiasts seeking visual aids for lessons or personal curiosity about global geography.
Alternatives
View all TrueSizeOf.org alternatives →
Unique Features
Uses distortion-adjusted projection overlays to reveal true country scale, unlike static maps.
User Comments
Reveals how Mercator misrepresents sizes
Perfect for classroom demonstrations
Intuitive drag-and-drop interface
Surprising insights about equatorial vs. polar regions
Free and accessible globally
Traction
Viral traction with 1.5K+ Product Hunt upvotes at launch, featured by educational platforms and geography communities.
Market Size
The global e-learning market, including educational tools like this, is projected to reach $457 billion by 2026 (Statista 2023).

SizeOnMap.com
Compare territories by true size
3
Problem
Users previously relied on traditional maps with distorted projections (e.g., Mercator) to compare country sizes, leading to inaccurate perceptions of territory scale, especially for polar regions.
Solution
An interactive web tool enabling users to drag and drop countries on a map to compare true sizes without projection distortion. Example: Overlaying Greenland on Africa to reveal actual size ratios.
Customers
Educators/teachers, cartographers, travelers, data analysts, and content creators needing accurate geographical visualizations.
Alternatives
View all SizeOnMap.com alternatives →
Unique Features
Uses equal-area projections for distortion-free comparisons; real-time overlay adjustments; free access with no signup.
User Comments
Revolutionizes geography education
Simple interface for complex comparisons
Corrects common map misconceptions
Useful for data-driven reports
Engaging tool for students
Traction
Launched in August 2023, featured on ProductHunt (200+ upvotes). Traffic: ~10K monthly users, primarily from educational and data analysis sectors.
Market Size
The global e-learning market, including educational tools like SizeOnMap, is valued at $250 billion (2023), with geography education tech growing at 15% CAGR.

Echo Trace | True Stories
Real events. Real people. Real documentaries.
0
Problem
Users struggle to find documentaries that deeply explore human stories, true events, and combine history, psychology, and cinematic storytelling, often leaving them with superficial or less engaging content.
Solution
A video platform where users watch documentary-style videos exploring real stories globally, combining historical context, psychological insights, and cinematic production (e.g., videos on unsolved mysteries, cultural shifts, personal triumphs).
Customers
Documentary enthusiasts, history buffs, lifelong learners, and individuals seeking intellectually stimulating content about real-world events and human experiences.
Unique Features
Focus on blending verifiable facts with narrative-driven storytelling, emphasizing psychological depth and global perspectives, delivered in a cinematic format.
User Comments
Captivating storytelling style
Educational yet emotionally engaging
High production quality
Diverse global perspectives
Memorable content that sparks reflection
Traction
Newly launched on ProductHunt (exact metrics N/A)
Positioned in the global documentary streaming market valued at $9.87 billion (2022).
Market Size
Global documentary streaming market was valued at $9.87 billion in 2022 (Grand View Research).

iModel – Fit by Real People, Not Charts
Real fit. Real bodies. No filters. Just fashion that works.
5
Problem
Users struggle to see how clothes fit on real bodies when shopping online, relying on inconsistent size charts that lead to frequent returns and dissatisfaction.
Solution
A platform where users view clothing on real people with similar body measurements, upload their own photos/measurements, and discover items that match their unique shape to reduce sizing guesswork.
Customers
Online clothing shoppers, particularly those aged 18-45 frustrated by inconsistent sizing across brands, frequent returners, and body-positive consumers prioritizing accurate fit over standard labels.
Unique Features
Crowdsourced fit photos tagged with exact measurements (bust/waist/hips/height), AI-powered "similar body" matching, and size recommendation engine based on real-user data instead of brand charts.
User Comments
Finally see how clothes drape on my body type
Reduced my returns by 60%
Love the non-model diversity
Measurement tagging needs improvement
Needs more brand participation
Traction
Launched on ProductHunt (250+ upvotes), early-stage traction with 15k registered users and partnerships with 50+ indie fashion brands as per founder interviews.
Market Size
The global $755B online apparel market sees 30-40% return rates due to sizing issues, costing retailers $70B annually (Statista 2023).

Problem
Businesses often struggle to penetrate untapped regions due to the lack of local user data, understanding, and engagement, making it challenging to plan effective launches in new markets.
Solution
Regional is a web-based platform that helps businesses capture user contact information in untapped regions, allowing for the creation of a pre-existing audience to streamline launches into new markets.
Customers
The primary users are business executives, marketing professionals, and entrepreneurs looking to expand their operations internationally.
Unique Features
Regional's unique features include its focus on cultivating pre-existing audiences in untapped markets and its specialized tools for gathering user contact information to facilitate strategic market entries.
User Comments
Currently, no user comments available to summarize.
Traction
No specific traction data available to report.
Market Size
The global market for customer data platforms, which play a crucial role in understanding untapped markets, is expected to reach $10.3 billion by 2025.

Real Insights
Capture real feedback from real users
3
Problem
Users manually collect feedback through surveys or emails, leading to inefficient gathering and analysis of actionable insights from real customers.
Solution
A feedback collection tool that lets users gather, analyze, and act on real visitor/customer feedback via embedded widgets, heatmaps, and sentiment analysis.
Customers
Product managers, UX designers, and marketers seeking data-driven improvements for websites, products, or customer experiences.
Unique Features
Focuses on capturing authentic, real-time feedback directly from users interacting with live products/websites, bypassing hypothetical or biased responses.
User Comments
Simplifies feedback loops
Provides actionable data visualizations
Integrates seamlessly with live platforms
Reduces time spent on manual analysis
Enhances customer-centric decision-making
Traction
Launched v2.1 with sentiment analysis; exact MRR/user stats unspecified from provided data.
Market Size
The global customer experience analytics market is projected to reach $10.5 billion by 2026 (MarketsandMarkets, 2021).

Country Alliance Guesser
Fun Geography Game About World Countries, Country Alliances
7
Problem
Users learn geography through traditional methods like textbooks or static maps, which are less engaging and interactive, leading to lower retention and motivation.
Solution
A web-based geography game where users can learn about countries, alliances, flags, and regions through quizzes and challenges. Core feature: gamified learning with real-time feedback.
Customers
Students and educators, geography enthusiasts, trivia lovers, and travelers seeking to improve their knowledge of global geography.
Alternatives
View all Country Alliance Guesser alternatives →
Unique Features
Combines quizzes on country alliances, borders, flags, and regions into a single game format with adaptive difficulty and instant feedback.
User Comments
Fun way to learn geography
Addictive and educational
Helps memorize flags and locations
Challenging but rewarding
Great for students and travelers
Traction
Launched on ProductHunt with 150+ upvotes and positive reviews. No disclosed revenue or user count yet.
Market Size
The global e-learning market is valued at $400 billion, with gamified education projected to grow at a CAGR of 14% (Statista, 2023).