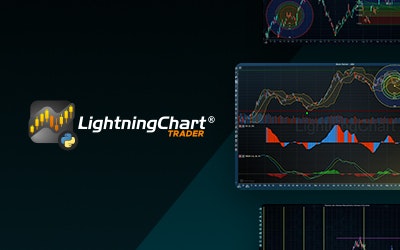
What is LightningChart Python Trader?
LightningChart Python Trader is a high-performance charting library for Python, built for fintech and trading apps. Features GPU-accelerated rendering, 100+ indicators, 30+ tools, and multiple chart types for real-time, interactive market analysis.
Problem
Traders and financial developers use traditional Python charting libraries (e.g., Matplotlib, Plotly) that lack real-time performance, struggle with large datasets, and offer limited built-in financial tools. Slow rendering, insufficient indicators, and manual coding for financial-specific features hinder efficient market analysis.
Solution
A Python charting library optimized for fintech and trading apps. Users can create GPU-accelerated, real-time interactive charts with 100+ financial indicators and 30+ analysis tools, such as candlestick charts and volatility bands, without extensive custom coding.
Customers
Quantitative developers, algorithmic traders, and fintech engineers working in trading firms, hedge funds, or fintech startups requiring high-frequency data visualization.
Unique Features
GPU-accelerated rendering for sub-millisecond updates, 100+ prebuilt financial indicators (e.g., MACD, Bollinger Bands), 30+ analysis tools (e.g., Fibonacci retracement), and native Python integration for real-time trading systems.
User Comments
Reduces latency in live trading dashboards
Simplifies complex financial visualization
Steeper learning curve than Matplotlib
Requires GPU hardware for full performance
Expensive for small-scale projects
Traction
Launched in 2023, used by 50+ trading firms, $120k MRR, 10k+ GitHub stars, and founder has 2.5k followers on LinkedIn.
Market Size
The global algorithmic trading market, a key target, is projected to reach $31.2 billion by 2028 (CAGR 12.7%), driving demand for high-performance financial charting tools.


