What is DataInfolab?
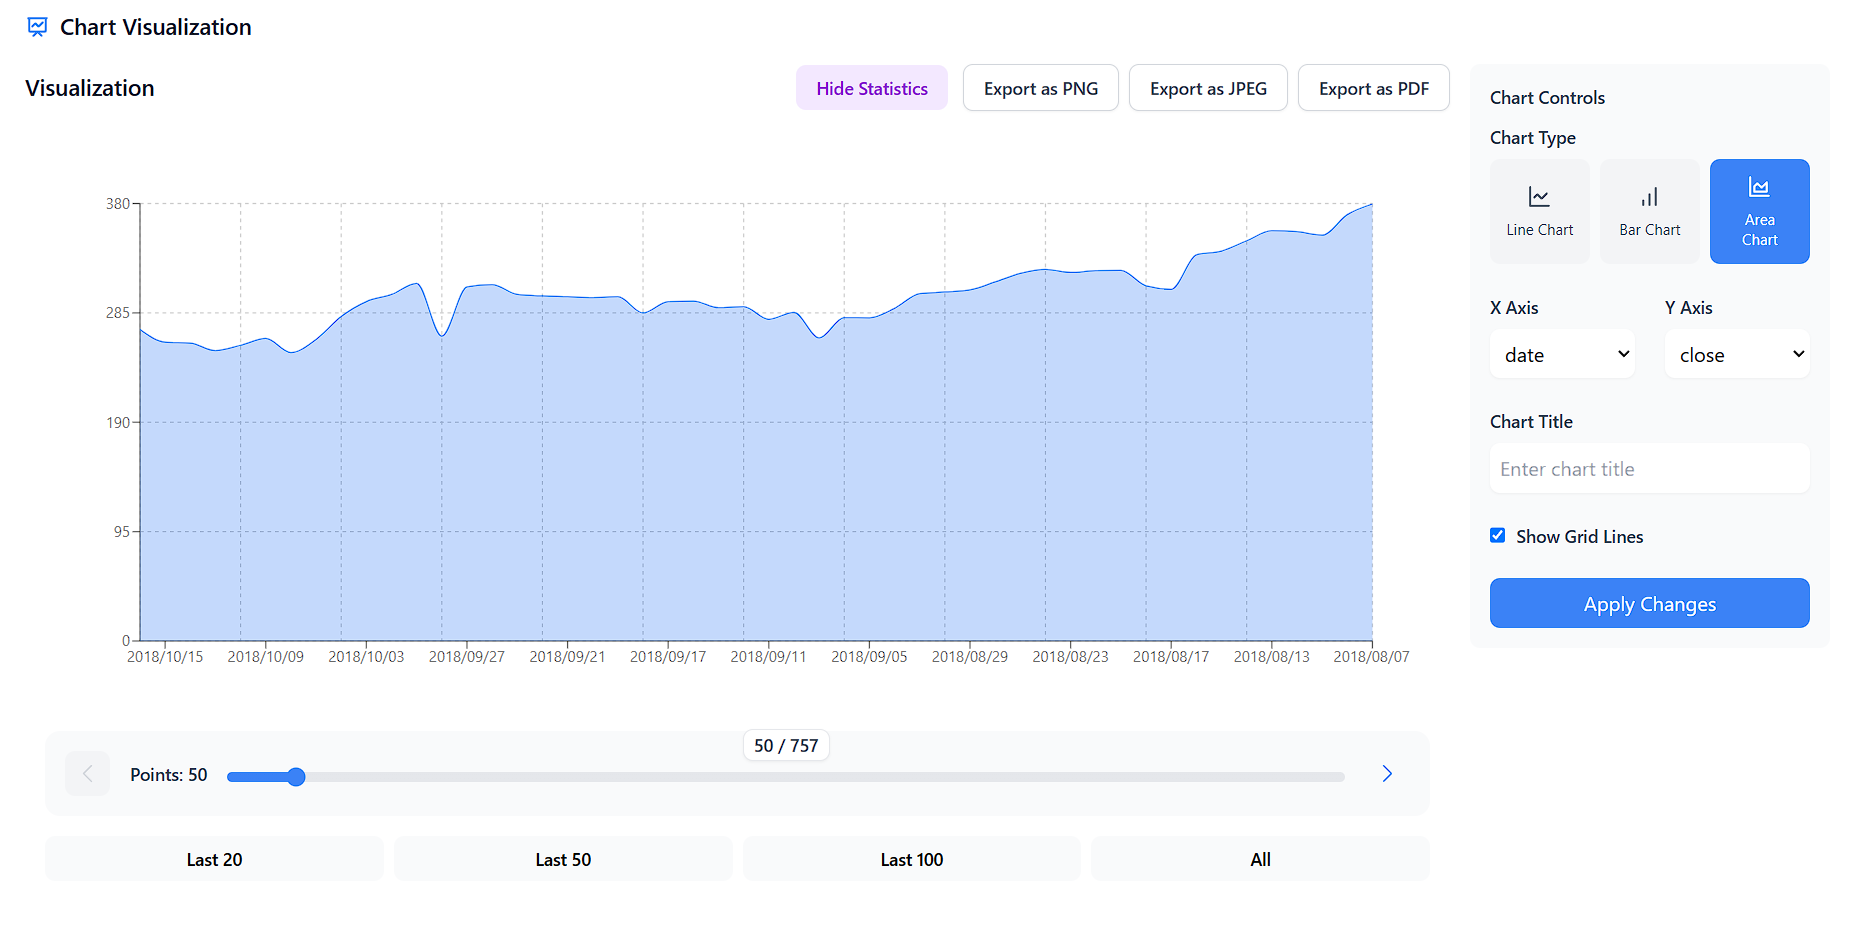
DataInfoLab.tech helps you turn raw data into beautiful visual insights instantly. Just upload your CSV, Excel, or JSON file and watch it come alive through interactive charts and filters. No setup. Just clean, visually stunning analytics in seconds!
Problem
Users struggle to transform raw spreadsheet data into interactive visual insights, relying on manual chart creation in tools like Excel, which is time-consuming and lacks dynamic filtering capabilities
Solution
Web-based data visualization tool where users upload CSV/Excel/JSON files to automatically generate interactive charts and filters, enabling instant data exploration without coding (e.g., turning sales figures into animated graphs)
Customers
Business analysts, product managers, and non-technical professionals needing quick data storytelling for reports/dashboards
Unique Features
Zero-setup visualizations with real-time interactivity, multi-format file support, and instant shareable outputs
User Comments
Saves hours on manual data processing
Makes complex data accessible to non-experts
Intuitive interface for quick insights
Missing advanced customization options
Revolutionized client reporting workflow
Traction
Launched 3 months ago with 2,500+ active users
Featured on ProductHunt's Top 20 Data Tools list
Founder @DataVizPro has 2.3K LinkedIn followers
Market Size
Global data visualization market projected to reach $10.2 billion by 2027 (MarketsandMarkets 2023)

