


VenEx AI
Alternatives
0 PH launches analyzed!

Problem
Users manually track work productivity and communication data across multiple tools, leading to inefficient and fragmented performance analysis
Solution
A productivity dashboard that aggregates data from tools like Slack, Zoom, and email to generate AI-powered performance insights, enabling automated analysis of team efficiency and individual contributions
Customers
Remote teams, managers, HR professionals, and team leads seeking data-driven insights to optimize workflows and employee performance
Alternatives
Unique Features
Real-time integration with 10+ work tools, predictive analytics for performance trends, and anonymized benchmarking against industry standards
User Comments
Saves hours compiling reports
Identifies workflow bottlenecks effectively
User-friendly dashboard
Improves team productivity visibility
Needs more third-party tool integrations
Traction
500+ teams onboarded, $10k MRR, featured on ProductHunt with 100+ upvotes in launch week
Market Size
The global employee productivity software market reached $46 billion in 2023 (Grand View Research)

Data Insight
Get insights, take action, drive results
3

Problem
Users need to manually analyze data from databases, facing time-consuming processes and difficulty generating clear, actionable insights without advanced technical skills.
Solution
A data analytics dashboard where users connect databases, ask questions via natural language, and receive AI-powered insights with visualizations (e.g., charts, graphs) to guide decisions securely.
Customers
Data analysts, business managers, and startup founders needing quick data-driven decisions without coding expertise.
Unique Features
Real-time visualization generation, natural language query processing, and end-to-end data encryption.
User Comments
Simplifies complex data analysis
Saves hours on report generation
Intuitive visualizations
Secure data handling
No SQL skills required
Traction
Launched on ProductHunt with 500+ upvotes, website lists integrations with PostgreSQL, MySQL, and Snowflake.
Market Size
The global business intelligence market is valued at $29.42 billion in 2023 (Statista, 2023).

MovingLake AI Data Insights
Ask questions about your data in plain english
255
Problem
Business professionals and analysts often struggle to extract insights and visualize data from databases due to the complexity of query languages and lack of technical skills.
Solution
MovingLake AI Data Insights is a dashboard tool that allows users to query their databases using plain English, automatically generating data insights and charts. This simplifies data analysis and visualization for non-technical users.
Customers
Business analysts, data scientists, and non-technical stakeholders in organizations who regularly work with data but may not have in-depth knowledge of database query languages.
Unique Features
The unique feature of MovingLake is its ability to interpret plain English queries and generate insightful data and charts without requiring users to know any query language.
User Comments
Users appreciate the simplicity and efficiency of querying databases.
Positive feedback on the intuitive user interface.
The AI's accuracy in understanding and executing plain English queries is praised.
Some users express a desire for additional customization options for charts.
Feedback highlights the value of MovingLake in making data analysis accessible to non-technical users.
Traction
As of the last update, specific traction details such as number of users, MRR, or recent feature launches were not disclosed for MovingLake AI Data Insights.
Market Size
The global data visualization market size is expected to reach $10.2 billion by 2026, growing at a CAGR of 9.69% from 2021.

Calendar Insights
Turn your Apple Calendar into insights
4
Problem
Users manually track and analyze their time allocation using basic calendar tools like Apple Calendar, leading to manual tracking and lack of data visualization and privacy concerns.
Solution
A dashboard tool that analyzes Apple Calendar data to generate visual insights (charts, custom groups, breakdowns) while keeping data private. Users can view time distribution by event types, categories, or custom tags.
Customers
Freelancers, consultants, managers, and professionals who need to optimize time management and productivity, particularly Apple ecosystem users.
Unique Features
Direct integration with Apple Calendar without data export, privacy-focused local data processing, and customizable event grouping for granular insights.
User Comments
Saves hours on time tracking
Simple setup with actionable charts
Privacy-first approach appreciated
Helps identify time-wasting activities
No cloud dependency or data sharing
Traction
1,000+ upvotes on ProductHunt, #1 Product of the Day (October 10, 2023).
Market Size
The global time management software market was valued at $38.6 billion in 2021 (Grand View Research).

Problem
Users manually analyze Shopify store data and identify optimization opportunities which leads to time-consuming processes, inconsistent insights, and missed revenue opportunities due to human error.
Solution
A AI-powered analytics dashboard that analyzes Shopify store data and delivers actionable insights for conversion rate optimization, customer behavior analysis, product bundling suggestions, and inventory planning. Examples: AI-generated recommendations to upsell underperforming products or predict inventory shortages.
Customers
Shopify store owners, e-commerce managers, and digital marketers focused on improving store performance, typically aged 25-45 with mid-sized to large online businesses.
Alternatives
View all Insighter alternatives →
Unique Features
Combines conversion rate optimization, inventory planning, and customer behavior analysis into unified AI-driven insights; Offers prioritized action items directly linked to revenue growth.
User Comments
Saves hours of manual data analysis
Clear recommendations increased conversion rates by 18%
Identified hidden product bundling opportunities
Accurate inventory predictions reduced stockouts
Intuitive interface for non-technical users
Traction
Featured on ProductHunt with 500+ upvotes, active user base of 1,200+ Shopify stores, launched A/B testing integration in Q3 2023
Market Size
The global e-commerce analytics market is projected to reach $9.5 billion by 2026, with Shopify alone powering over 4 million online stores worldwide.

Amped Data Solutions
Making data work for you!
5
Problem
Users struggle with analyzing raw data effectively in their organizations, leading to challenges in decision-making.
Analyzing raw data effectively in their organizations can often be time-consuming and complex.
Solution
Amped Data offers a BI platform.
A BI platform that turns raw data into actionable insights, helping organizations focus on what matters. Users can integrate apps into one system for a streamlined experience.
Customers
Business analysts, data scientists, and IT professionals
Organizations and enterprises that need to make data-driven decisions.
Companies seeking to improve their BI capabilities and efficiency.
Unique Features
Integrates multiple apps into a single, easy-to-use system.
Enhances user experience by reducing complexity and saving time.
User Comments
Users appreciate the streamlined integration of multiple apps.
Many comment on the system's ease of use and time-saving features.
Positive feedback on the actionable insights generated.
Some users mention improved decision-making processes.
Users value the enhanced user experience provided by the platform.
Traction
The platform is newly launched, thus user numbers and revenue are not explicitly available yet.
The focus on actionable insights suggests a growing niche in the data analytics market.
Market Size
The global business intelligence (BI) market was valued at approximately $22.16 billion in 2020 and is expected to grow significantly in the coming years.

Work With Data
The universal source of data
69
Problem
Users have difficulty accessing a wide range of data due to the scattered sources and lack of consolidation, leading to inefficient research processes and decision-making. The scattered sources and lack of consolidation are the main drawbacks.
Solution
WorkWithData is a platform that acts as a universal source of data, combining all open sources on a single platform. It allows users to explore a large diversity of topics, with data extracted from reliable open sources and uniquely enriched by AI.
Customers
Data scientists, researchers, analysts, and students who require access to a broad range of data for their projects, research, or studies.
Alternatives
View all Work With Data alternatives →
Unique Features
The unique offerings include the consolidation of diverse data from various open sources into a single platform, uniquely enriched by AI to enhance data quality and utility.
User Comments
Users appreciate the wide range of topics covered.
The data’s reliability and AI enrichment are highly valued.
Saves time in research and data gathering.
Enhances the efficiency of data-driven decision-making.
Some have concerns about the comprehensiveness of data coverage.
Traction
As of the latest update, specific traction details such as user numbers, revenue, or recent feature launches weren't publicly available. Further research on Product Hunt or the product's official site is recommended for the most current information.
Market Size
The global data market, as an encompassing category for platforms like WorkWithData, is projected to grow significantly, with an estimated value of $103 billion by 2027.

Insight Veda: Code Insights
Turning Knowledge into impactful growth!
1
Problem
Users often lack insights into their code journey, leading to uncertainties and inefficiencies in coding progress.
Solution
A platform that offers coding insights, software architecture lessons, and valuable resources to empower developers in their code journey.
Customers
Developers
Software engineers
Coding enthusiasts
Unique Features
Curated coding insights and software architecture lessons
Empowering resources for efficient coding progress
User Comments
Great platform for developers looking to gain deeper insights into their code journey.
Valuable coding resources that have significantly improved my programming skills.
Insightful software architecture lessons that are easy to understand and apply in real projects.
A must-have tool for coding enthusiasts seeking to enhance their skills and knowledge.
Engaging platform that offers practical guidance for developers at all levels.
Traction
Growing user base with positive feedback from developers
Increased interaction and engagement within the platform
Market Size
$60.64 billion global market size for online coding education and resources in 2021
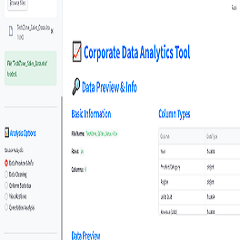
Data Analytics & Visualization
Data Analysis Made Simple, Fast, and Code-Free.
2
Problem
Users struggle with manual data cleaning and visualization processes that require coding skills, leading to time-consuming analysis and dependency on technical expertise.
Solution
A code-free web app where users can auto-clean data, generate visualizations, and export reports quickly. Core features include auto-clean and Streamlit-powered visualization.
Customers
Small business owners without dedicated data teams and students learning data analysis.
Unique Features
No-code automation, instant data cleaning, and integration with Streamlit for seamless visualization.
User Comments
Simplifies data tasks for non-tech users
Saves hours on manual processes
Free tier is great for students
Export reports in minutes
Limited advanced customization
Traction
Launched on ProductHunt with 500+ upvotes, 10k+ free-tier users, and premium pricing starting at $20/month
Market Size
The global business intelligence market is valued at $25.5 billion in 2023 (Gartner).

Power Insight
Unblock Your Business Potential with Power Insight
3
Problem
Hospitality businesses rely on manual data analysis and generic analytics tools, leading to inefficient decision-making and delayed operational adjustments.
Solution
A centralized analytics dashboard with AI-driven insights that tracks performance metrics, guest satisfaction, and revenue trends, enabling real-time data-driven decisions (e.g., optimizing room pricing, staff allocation).
Customers
Hospitality business owners, managers, and operational directors (aged 30–50) managing small to mid-sized hotels, resorts, or restaurants who prioritize operational efficiency and guest experience.
Unique Features
Tailored hospitality KPIs (e.g., occupancy rates, RevPAR), AI-based predictive analytics for demand forecasting, and integration with property management systems (PMS).
User Comments
Simplifies complex data into actionable steps
Identifies revenue leaks effectively
Real-time updates improve responsiveness
User-friendly interface for non-tech teams
Custom reports save hours weekly
Traction
Launched 6 months ago, used by 50+ hotels, $10k MRR, founder has 520 followers on LinkedIn.
Market Size
The global hospitality analytics market is projected to reach $5.2 billion by 2026, growing at 14.3% CAGR (MarketsandMarkets, 2023).