Tractorscope
Alternatives
0 PH launches analyzed!

Tractorscope
The Developer’s Data Visualization Platform
64
Problem
Developers often struggle to create and embed data visualizations into apps efficiently. Traditional methods can be overly complex and require extensive coding, which is time-consuming and not cost-effective.
Solution
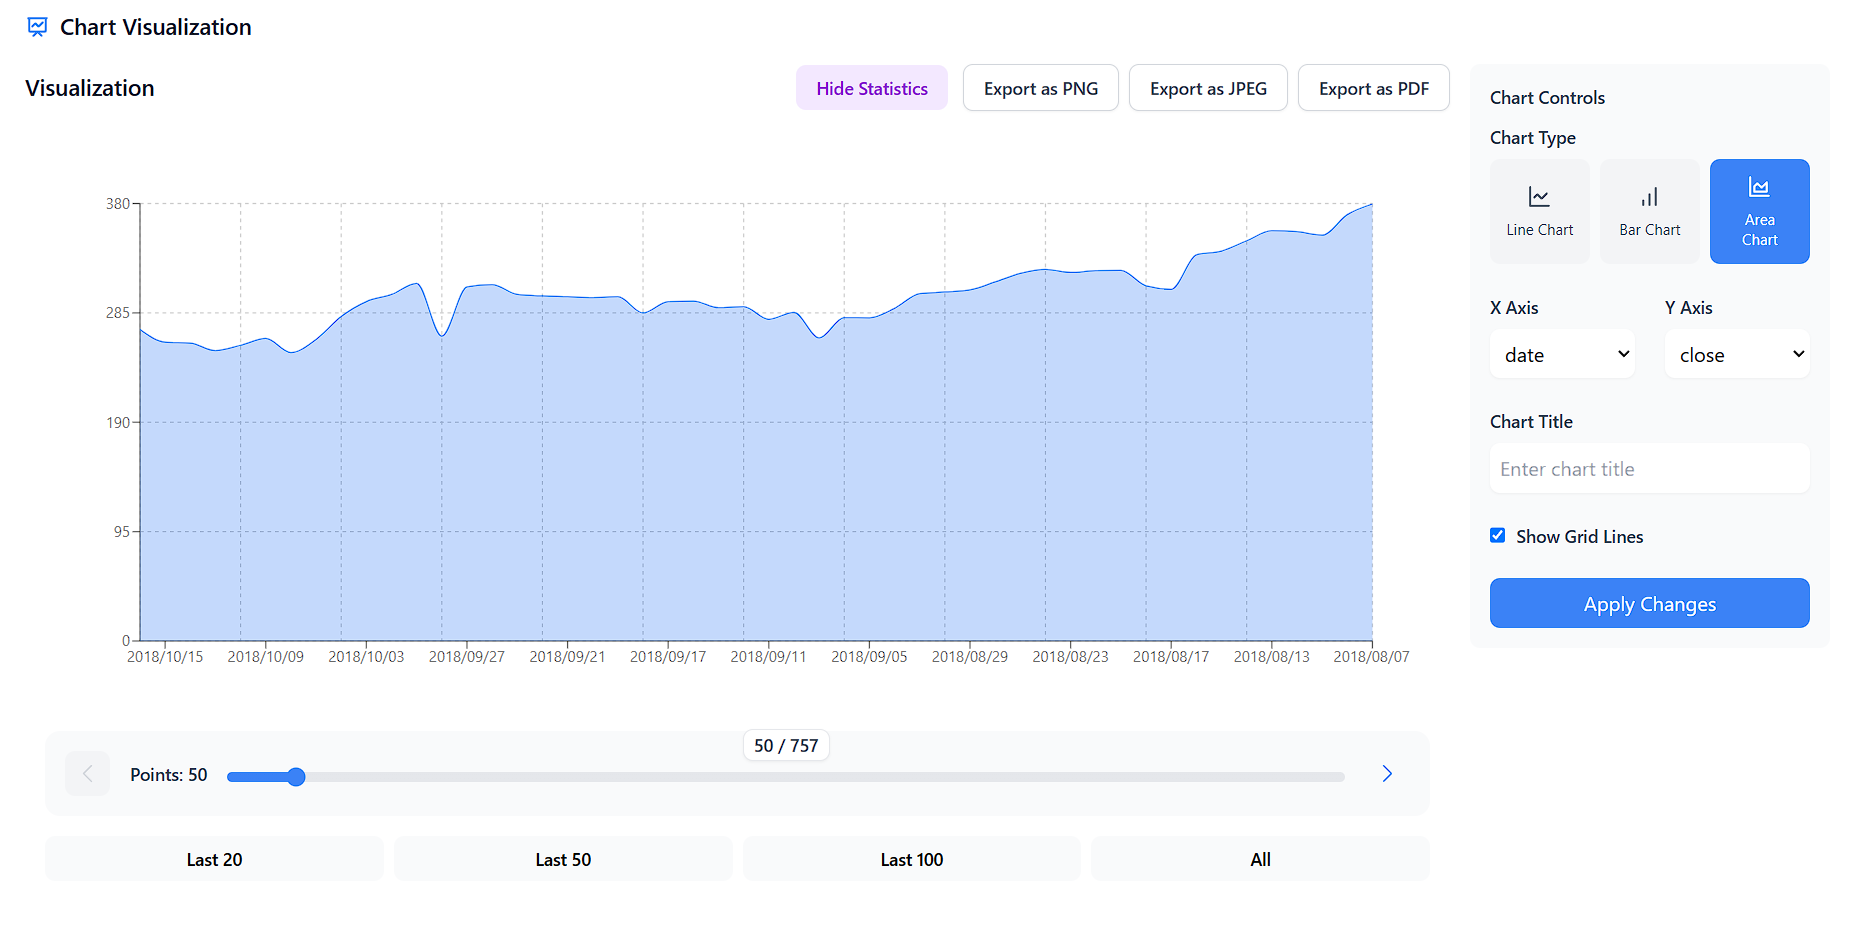
Tractorscope is a developer’s platform focused on data visualization. It allows developers to easily create and embed personalized data visualizations with minimal coding. Developers can use this tool to efficiently generate quick and visually appealing data dashboards.
Customers
The primary users of Tractorscope are developers focusing on software and app development, particularly those interested in integrating sophisticated data visualizations within their products.
Alternatives
Unique Features
Minimal coding requirement for embedding dashboards, cost-effective solution, and easy customization for user-specific data visualization needs.
User Comments
User comments unavailable as of now.
Traction
Traction data unavailable as of now.
Market Size
The global data visualization market is projected to reach $19 billion by 2027.

CSV Data Visualizer
CSV Visualizer: Turn raw data into stunning visuals fast! 📊
5
Problem
Users often struggle to visualize CSV data and create compelling visuals quickly.
Existing solutions for data visualization may be complex, time-consuming, and require a steep learning curve.
Solution
Web-based CSV Data Visualizer tool
Users can quickly turn raw data into stunning visuals in seconds without the need for subscriptions or hidden fees.
Core features include: fast data visualization, user-friendly interface, no subscriptions or fees.
Customers
Students, analysts, and data geeks who need to visualize CSV data quickly and effectively.
Alternatives
View all CSV Data Visualizer alternatives →
Unique Features
Fast data visualization in seconds
No subscriptions or hidden fees, 100% free online tool.
User Comments
Intuitive tool for quick data visualization.
Great for students and data analysts.
The free offering is a significant advantage.
Simple and effective solution for visualizing CSV data.
User-friendly interface for creating stunning visuals.
Traction
Over 5,000 users registered within the first week of launch.
Continuously improving features based on user feedback.
No specific revenue data provided.
Market Size
Global data visualization market size was estimated at $5.9 billion in 2020, and it is projected to reach $10.2 billion by 2025 with a CAGR of 11.6%.

ZinkML Data Science Platform
Zero-code, end-to-end, collaborative data science platform.
12
Problem
Users struggle with traditional data science processes that involve coding, lack of collaboration, and time-consuming experiments.
Drawbacks: Traditional processes hinder productivity, limit collaboration, and slow down the development and deployment of machine learning use cases.
Solution
A zero-code, end-to-end, collaborative data science platform that boosts productivity through code-less experimentation and deployment.
Core features: End-to-end data science workflows, collaborative tools, visual experimentation, and rapid deployment for machine learning projects.
Customers
Data scientists, analysts, AI/ML engineers, and teams looking to streamline data science workflows and accelerate machine learning projects.
Occupation: Data scientists, AI/ML engineers, analysts.
Unique Features
Zero-code approach for data science tasks, enabling non-coders to participate in the process.
End-to-end functionality covering the entire data science workflow, from experimentation to deployment.
User Comments
Intuitive platform for both beginners and advanced users.
Saves time and effort in developing and deploying ML models.
Great collaboration features enhance team productivity.
Visual tools make experimentation easy and effective.
Highly recommended for fast-paced data science projects.
Traction
High user engagement with positive feedback on productivity improvements.
Growing user base with increasing adoption rates.
Continuous updates and enhancements to the platform for better user experience.
Market Size
$13.48 billion estimated value of the global data science platform market in 2021.
Expected to reach $33.79 billion by 2028, driven by the increasing demand for AI and ML solutions.

Flatfile Data Exchange Platform
API-based platform to build ideal data-file import solutions
259
Problem
Developers often struggle with building and implementing customizable, powerful workflows for file-based import use cases, leading to inefficient data import processes and a poor user experience due to lack of flexibility and robustness.
Solution
Flatfile's Data Exchange Platform is an API-based platform that enables developers to create fully customizable, powerful workflows for any file-based import use case, simplifying the data import process and improving user experience.
Customers
Developers who need to implement customizable data import solutions for various applications.
Unique Features
The platform’s extensibility and ability to address any file-based import use case with robust workflows.
User Comments
Not enough user comments available to summarize.
Traction
Not enough traction data available to summarize.
Market Size
The global data integration market size is expected to reach $22.4 billion by 2025.
Code Visualization Platform
Algorithm visualization platform
3
Problem
The current situation for users involves visualizing algorithms, data structures, and code execution primarily through static or non-interactive tools.
The drawbacks include a lack of real-time interactivity and limited support for Python and JavaScript, which can hinder effective learning and debugging of DSA concepts.
Solution
An algorithm visualization platform that allows users to experience real-time visualization of algorithms, data structures, and code execution in Python & JavaScript.
Users can effectively learn DSA, teach computer science, and debug code through this dynamic interactive platform.
Customers
Computer science students, educators, and software developers looking to enhance their understanding of algorithms and data structures.
Unique Features
The product offers real-time visualization specifically focused on Python and JavaScript, which aids interactive learning and debugging.
Market Size
The global EdTech and smart classroom market was valued at approximately $88.82 billion in 2021 and is expected to grow, driven by increasing digitization in education.

Joker Visual Dev Platform
AI Coding + Visual Cloud IDE
3
Problem
Users experience fragmented workflows between coding and visual design using traditional development environments, leading to inefficiency and a steep learning curve.
Solution
A visual cloud IDE tool that combines AI-powered code suggestions with drag-and-drop visual programming, enabling real-time collaboration and automated code generation (e.g., building UI components visually with AI-assisted backend logic).
Customers
Developers, engineering managers, and startup teams seeking rapid prototyping and reduced dependency on specialized roles.
Unique Features
Seamless integration of AI pair programming (like GitHub Copilot) within a browser-based visual IDE, allowing direct manipulation of code and UI elements in one interface.
User Comments
Accelerates frontend-backend integration
Reduces repetitive coding tasks
Intuitive for non-experts but scalable for pros
Occasional AI logic mismatches
Limited language/framework support
Traction
Launched v1.2 with Figma-to-code sync in Q2 2024; 10k+ active dev teams, $85k MRR (self-reported via Product Hunt comment history).
Market Size
The global low-code development platform market is projected to reach $15 billion by 2024 (Gartner).
Problem
Developers often struggle to efficiently build interactive, real-time data apps due to the complexity of pulling data from multiple sources like APIs, databases, and event streams, and the challenges involved in creating engaging UIs and data visualizations. The complexity of integrating multiple data sources and creating interactive user interfaces significantly slows down development.
Solution
Kelp is a visual development platform designed specifically for coding and deploying interactive data apps. It allows developers to easily pull data from various sources, including APIs, databases, and event streams. The platform offers a visual dataflow editor for mashing up data, and features for creating highly interactive UIs and data visualizations. Everything can be deployed and run on the cloud. Kelp enables developers to build data apps more efficiently by simplifying the integration of multiple data sources and the creation of interactive UIs.
Customers
Software developers and data scientists who are involved in creating interactive, real-time data applications for businesses or personal projects. These are typically individuals or teams looking to streamline their app development process and are interested in leveraging visual tools to speed up development.
Alternatives
View all Kelp.app alternatives →
Unique Features
Kelp distinguishes itself with its visual dataflow editor, allowing for intuitive data integration and manipulation. Its support for creating interactive, real-time user interfaces and data visualizations directly from various data sources sets it apart. The ability to deploy and run apps on the cloud enhances its appeal by simplifying the deployment process.
User Comments
Positive feedback on ease of use.
Appreciation for the visual dataflow editor.
Praise for the platform's ability to streamline development.
High regard for the interactive UI creation tools.
Satisfaction with cloud deployment features.
Traction
Unfortunately, without current access to real-time web data, specific traction metrics such as number of users, MRR/ARR, or financing details for Kelp cannot be provided at this time.
Market Size
The global market for business intelligence and analytics software is projected to reach $33.3 billion by 2025, growing at a CAGR of 7.6% from 2020 to 2025. While not exclusively dedicated to interactive data apps, this market encompasses tools and platforms like Kelp, indicating a lucrative and expanding field.

Data Analytics & Visualization
Data Analysis Made Simple, Fast, and Code-Free.
2
Problem
Users struggle with manual data cleaning and visualization processes that require coding skills, leading to time-consuming analysis and dependency on technical expertise.
Solution
A code-free web app where users can auto-clean data, generate visualizations, and export reports quickly. Core features include auto-clean and Streamlit-powered visualization.
Customers
Small business owners without dedicated data teams and students learning data analysis.
Unique Features
No-code automation, instant data cleaning, and integration with Streamlit for seamless visualization.
User Comments
Simplifies data tasks for non-tech users
Saves hours on manual processes
Free tier is great for students
Export reports in minutes
Limited advanced customization
Traction
Launched on ProductHunt with 500+ upvotes, 10k+ free-tier users, and premium pricing starting at $20/month
Market Size
The global business intelligence market is valued at $25.5 billion in 2023 (Gartner).
Slurp Data Services Platform
Easy, code-free data service provisioning and integration
6
Problem
Users need to provision and integrate data services across different platforms like Windows, Unix, or Cloud.
Traditional solutions often require significant technical knowledge and coding skills.
Significant technical knowledge
coding skills
Solution
A platform that provides easy, code-free data service provisioning and integration.
easy, code-free data service provisioning and integration
Allows users to effortlessly set up data services without extensive technical knowledge.
Customers
Data analysts
IT administrators
business professionals
Individuals looking to manage data services on Windows, Unix, or Cloud environments without coding.
Unique Features
Combination of no-code interface with high-performance capabilities for data services.
Cross-platform compatibility for Windows, Unix, and Cloud.
User Comments
The platform is user-friendly and reduces the need for coding.
Provides efficient data service management.
Helps streamline data service integration significantly.
Valuable for users lacking technical expertise.
Revolutionizes the ease of accessing and managing data services.
Traction
Recently launched on ProductHunt.
Garnering attention for its user-friendly approach to data service management.
Tracking interest from IT and business communities.
Market Size
The global market for no-code platforms was estimated to be worth $13 billion in 2021.

Orchestra Data Platform
Rapidly build and monitor Data and AI Products
52
Problem
Tech-first organizations face challenges optimizing data quality, cost, failures, data volumes, and durations for specific Data and AI products, and consolidating tooling is difficult. Data Lineage is also a concern.
Solution
Orchestra is a platform that allows users to rapidly build and monitor Data and AI Products, optimizing data quality, cost, failures, data volumes, and durations from a single place while consolidating tooling. Data Lineage is included.
Customers
Tech-first organizations, data scientists, AI researchers, and data engineers are the primary users likely to use this product.
Alternatives
View all Orchestra Data Platform alternatives →
Unique Features
Consolidation of tooling, optimization of data products including quality and cost, inclusion of Data Lineage for enhanced tracking and analysis.
User Comments
Solves complex data management effectively
Simplifies the monitoring of Data and AI products
Effective in consolidating tooling
Useful for optimizing data costs
Helps in understanding Data Lineage
Traction
Specific traction data not available
Market Size
The global market for AI and Big Data Analytics was valued at $68.09 billion in 2020 and is expected to grow.
