


Stockstack
Alternatives
0 PH launches analyzed!

Stockstack
Distraction-free stock market data dashboard
33

Problem
Users face challenges maintaining an organized investment tracking system, often dealing with fragmented data sources, inefficient portfolio overview, and lack of actionable insights.
Solution
StockStack is a dashboard tool that allows users to aggregate investment data from multiple exchanges. It provides features like portfolio monitoring, asset allocation visualization, and investment insights.
Customers
Individual investors, portfolio managers, and finance enthusiasts who regularly track and manage their investments across various platforms.
Unique Features
StockStack's uniqueness lies in its comprehensive dashboard that consolidates investment data, enhancing the ability to make informed investment decisions with ease.
User Comments
Users appreciate the centralized portfolio view.
Ease of use and clean interface mentioned positively.
Users note the actionable insights provided.
Some reports of minor bugs and feature requests.
Overall, users find it to be a time-saving tool for investment management.
Traction
StockStack has a growing user base with positive user feedback but specific quantitative traction data like MRR, user count, or funding status is not provided.
Market Size
The global portfolio management market size is substantial, with a reported value of $14.31 billion as of 2020 and expected growth.

Free Dashboards by Master Metrics
Free Marketing Visualization AI Tool. No connectors needed.
28
Problem
Users face the challenge of creating marketing visualizations and real-time reports quickly without paying for connectors to include data from platforms like Google, Meta, Linkedin, or TikTok. This leads to time-consuming manual work and additional costs.
Solution
A free marketing visualization tool that offers marketing templates and allows users to create real-time reports within seconds without the need for connectors. Users can easily include data from platforms like Google, Meta, Linkedin, or TikTok in their reports and send data to Google Sheets.
Customers
Marketers, small business owners, and marketing professionals who need to create marketing visualizations and reports quickly without incurring additional costs.
Unique Features
Does not require connectors for platforms like Google, Meta, Linkedin, or TikTok, making it a cost-effective solution.
Offers a range of marketing templates for quick visualization creation.
Enables real-time report generation within seconds.
User Comments
Easy-to-use tool for creating marketing dashboards.
Saves time and money by not needing additional connectors.
Great for small businesses looking to visualize their marketing data effectively.
Simple interface with a variety of templates.
Efficient way to share data through Google Sheets.
Traction
The product has gained significant traction with over 10,000 active users.
It has received positive feedback on ProductHunt with a high number of upvotes and comments.
Market Size
The global marketing analytics market was valued at approximately $2.1 billion in 2020 and is expected to reach $4.4 billion by 2026, with a CAGR of around 14%.

Morning Stock Market
Newsletter for the top stock market stories.
2
Problem
Users need to stay updated with the latest stock market news but face information overload from multiple sources
Drawbacks: Struggling to find concise summaries of important market news
Solution
Newsletter service
Delivers concise summaries of the most important market news to users
Core features: Provides concise summaries of top stock market stories
Customers
Investors, traders, financial professionals, and individuals interested in stock market news
Occupation: Investors, traders, financial professionals
Alternatives
View all Morning Stock Market alternatives →
Unique Features
Focuses on delivering concise summaries of the top stock market stories
Free weekday newsletter service
User Comments
Delivers the information I need quickly and efficiently
Great way to stay informed without spending hours searching for news
Concise and to the point, perfect for busy professionals
Easy to read format, well-curated content
Helped me save time in keeping up with stock market news
Traction
Growing subscriber base
High open and click-through rates
Positive user feedback
Increasing engagement on the platform
Market Size
$1.2 billion market size for financial news and analysis services
Increasing demand for stock market information globally

Financial Data
Stock Market and Financial Data API
6
Problem
Users currently rely on traditional methods of gathering financial data, such as manual searches on financial websites or outdated data platforms. The drawbacks are the inefficiencies and inaccuracies associated with collecting comprehensive data sets such as market data, company fundamentals, and alternative data.
Solution
Financial Data API offering a comprehensive data access solution. Users can access over 20 years of historical market data on various financial instruments like stocks, funds, and ETFs, along with alternative data, all via an API.
Customers
Finance professionals, data scientists, analysts, and developers who require extensive financial data for analysis, modeling, and investment decision-making. Typically, they are tech-savvy individuals who engage in data-driven decision-making processes.
Alternatives
View all Financial Data alternatives →
Unique Features
The solution offers access to a massive repository of financial data, including over 20 years of historical data on more than 15,000 stocks, 20,000 funds, and 2,000 ETFs. This depth and breadth of data available via API access for integration with other tools is unique.
User Comments
Users appreciate the comprehensive data coverage.
Easy integration with existing systems via API.
Some users request more real-time data updates.
Positive feedback on historical data depth.
Some concerns about the learning curve for new users.
Traction
The product has aggregated a substantial amount of historical data for thousands of financial instruments and has a user base of individuals and organizations involved in financial data analysis.
Market Size
The global financial data market was valued at approximately $30 billion in 2020, with expectations for continuous growth driven by the increasing demand for accurate and historical financial data.

Samhub Marketing Dashboard
All your marketing metrics in one tab—ready for reporting
2
Problem
Users currently have to jump between different tabs and copy and paste data into spreadsheets to manage and consolidate marketing metrics, which is time-consuming and inefficient. The drawbacks of this old situation are jumping between tabs and copying and pasting data into spreadsheets.
Solution
Samhub's marketing dashboard allows users to have all their marketing metrics in one place, always up-to-date, and ready to be shared as insightful reports. With this tool, users can effectively consolidate data without the manual hassle.
Customers
Marketing managers, digital marketers, and business owners who are responsible for tracking and reporting on marketing data and performance metrics are most likely to use this product.
Unique Features
The unique aspect of Samhub's solution lies in its ability to provide an all-in-one marketing dashboard that eliminates the need for manual data consolidation and offers real-time updates accessible from a single interface.
User Comments
Users appreciate how Samhub centralizes their marketing data into a single dashboard.
Real-time updates are considered a major advantage.
The product simplifies the data reporting process significantly.
Some users find the user interface intuitive and easy to use.
There are requests for more integrations with other marketing platforms.
Traction
Currently does not have specific quantified traction metrics like number of users or MRR publicly available. However, available information suggests a focus on unique, simplified marketing data management solutions.
Market Size
The global marketing analytics software market is projected to reach $4.68 billion by 2026, with a CAGR of 14.5%.

Distraction-Free for YouTube Pro
Reclaim your YouTube experience –no distractions, just focus
4
Problem
Users experience a cluttered YouTube interface with numerous distractions such as ads, recommendations, and comments, which hinders their ability to focus on content. This clutter negatively impacts productivity and concentration.
Solution
A Chrome extension that offers a distraction-free experience on YouTube by removing unnecessary elements in one click. It allows users to eliminate distractions like ads, recommendations, and comments, making it easier to focus on their videos.
Customers
Students, professionals, and content consumers who want to improve their focus and productivity while using YouTube across demographics that frequently use YouTube for learning, work, or entertainment.
Unique Features
The extension provides a one-click solution specifically targeting and removing typical YouTube distractions comprehensively, offering a very streamlined and focused viewing experience compared to partial solutions.
User Comments
Users appreciate the simplicity and efficacy of removing distractions.
The tool is praised for enhancing productivity and focus.
Some users find it essential for educational or work-related video content.
Feedback highlights an easy installation and user-friendly experience.
Some users express a desire for additional customizable settings.
Traction
The product has been featured on ProductHunt, indicating a level of community interest and engagement, though explicit user or revenue figures are not provided.
Market Size
The global browser extension market was valued at $1.31 billion in 2019 and is projected to reach $2.70 billion by 2027, showcasing potential growth for productivity-oriented Chrome extensions like this.

Stock Market GPT for Investment Research
AI powered stocks, balance sheets, analyst report comparison
69
Problem
Investors and analysts often spend excessive amounts of time analyzing financial data and stock market trends, leading to delayed decision-making. The major drawbacks of this old situation are the time-consuming nature of investment research and the complexity of comparing different financial reports and balance sheets.
Solution
Stock Market GPT is a dashboard-equipped investment research bot that utilizes AI to streamline stock market analysis. Users can leverage its AI-powered tools to rapidly compare balance sheets and analyst reports, significantly reducing the time needed for investment decision-making. The core features include AI-powered comparison of stocks, balance sheets, and analyst reports to aid in swift investment decisions.
Customers
The primary users of this product are investors, financial analysts, and stock market enthusiasts who regularly engage in stock market investment research and need to quickly analyze and compare financial data for making informed decisions.
Unique Features
Its unique proposition lies in its ability to instantly analyze and compare vast amounts of financial data through AI, presenting complex information in an accessible and concise manner for rapid decision-making.
User Comments
The comments are not accessible without product-specific user testimonials or reviews. Thus, cannot provide direct feedback summary.
Traction
Specifics on the product's traction such as user numbers, revenue, or recent updates are not available due to limited information access.
Market Size
The global AI in the financial market was valued at $7.91 billion in 2020 and is expected to reach $26.67 billion by 2026, growing at a CAGR of 23.17%.
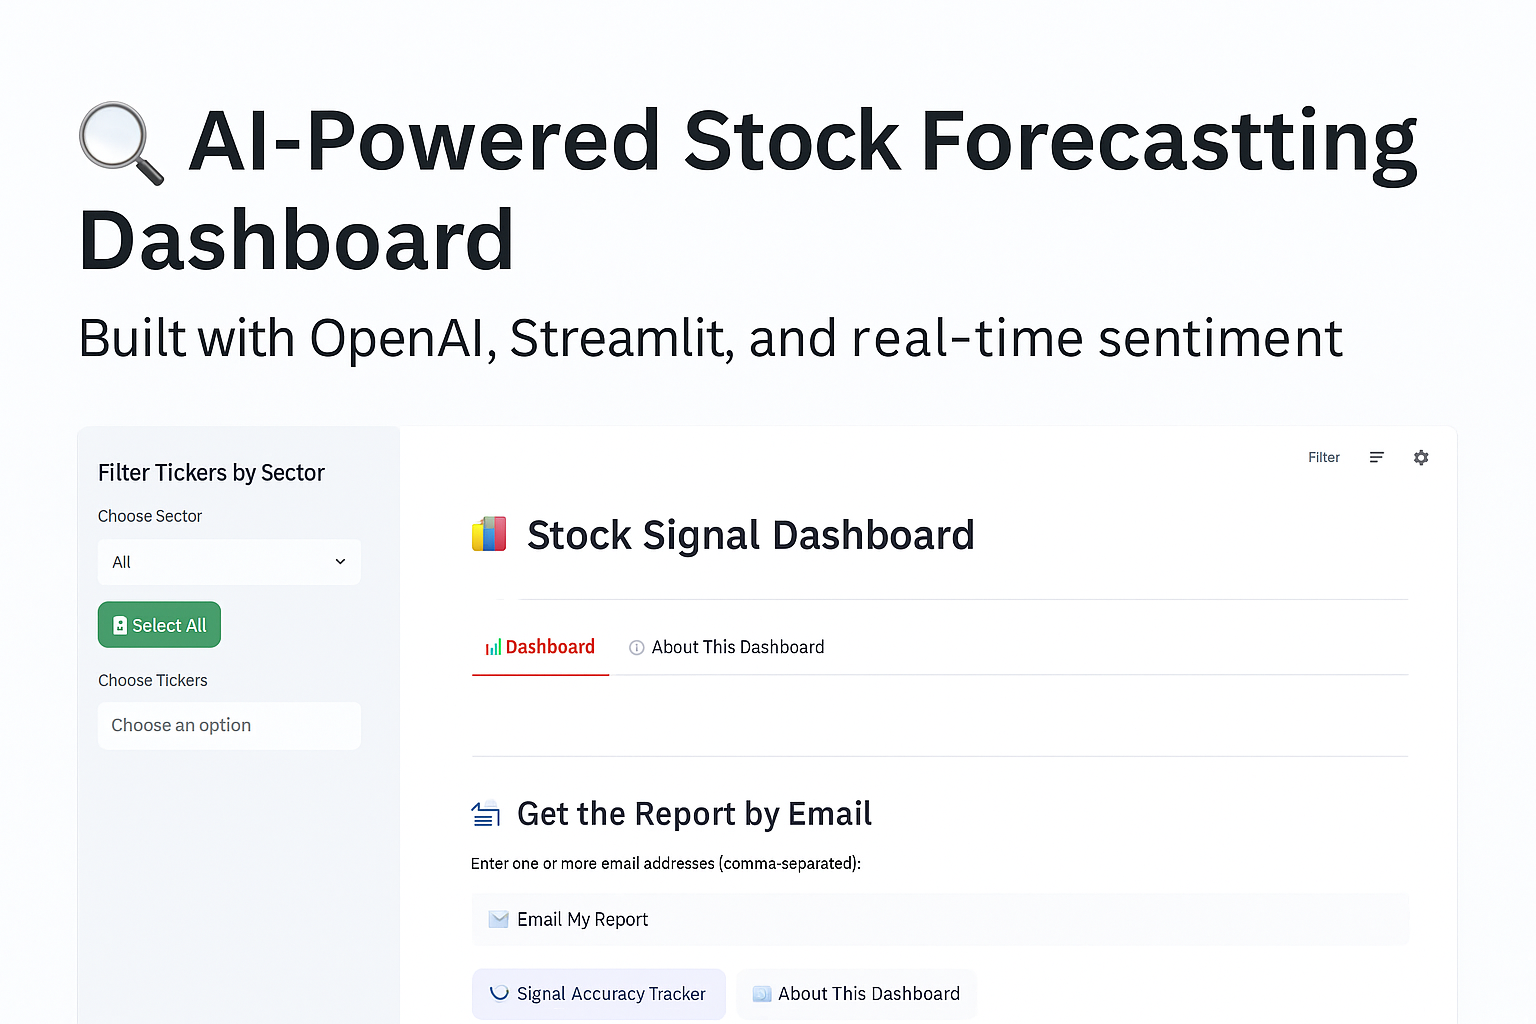
Stock Forecasting Dashboard
📈 Forecasts 📊 Confidence 🧵 Reddit 🧠 Explainable Signals
2
Problem
Investors manually analyze stock data using spreadsheets, news, and basic tools which is time-consuming and error-prone due to fragmented data sources and subjective interpretation.
Solution
A stock forecasting dashboard combining AI models, real-time sentiment analysis, and macroeconomic data to generate explainable stock signals (e.g., price predictions, confidence intervals, Reddit sentiment trends).
Customers
Retail investors and financial analysts seeking data-driven decisions without advanced technical skills.
Unique Features
Integrates explainable AI signals, Reddit sentiment trends, and macroeconomic factors into a single dashboard with transparent confidence metrics.
User Comments
Simplifies stock research
Reddit sentiment integration is unique
Confidence intervals improve trust
Macro data adds context
User-friendly for non-experts
Traction
Launched on ProductHunt (exact metrics unspecified), targeting the $18B algorithmic trading market with 100M+ global retail investors.
Market Size
The global algorithmic trading market is valued at $18.8B in 2023 (MarketsandMarkets).

Sectors Are There In Indian Stock Market
how many sectors are there in indian stock market
2
Problem
Users need to manually research and categorize sectors in the Indian stock market, facing time-consuming processes and inconsistent or outdated information.
Solution
A web-based tool that provides a structured, categorized list of Indian stock market sectors, enabling users to quickly access sector classifications (e.g., financials, technology) with examples like NIFTY sector indices.
Customers
Investors, financial analysts, and stock market students seeking organized sector data for decision-making or educational purposes.
Unique Features
Focuses exclusively on Indian market sectors with clear categorization, simplifying complex market structures for users.
User Comments
Saves research time
Clear sector breakdown
Helpful for beginners
Lacks real-time updates
Needs more granular data
Traction
Newly launched on ProductHunt (exact metrics unavailable), likely targeting India's growing retail investor base (over 20 million active users in 2023).
Market Size
Indian equity market capitalization reached $3.4 trillion in 2023, driven by retail participation and sector-specific investments.

Graphy for Marketers
The fastest way to unify your marketing data.
501
Problem
Users struggle to unify data from various marketing tools, leading to time-consuming and complex processes for creating marketing reports.
Solution
Graphy is a dashboard tool that simplifies the creation of marketing reports by unifying data from all marketing tools in one shareable view. It's designed to be as easy as taking a screenshot but as powerful as a full dashboard.
Customers
Marketing professionals, digital marketers, and data analysts working in companies of all sizes who need to create and share marketing reports efficiently.
Alternatives
View all Graphy for Marketers alternatives →
Unique Features
The solution's unique approach lies in its simplicity combined with power. The process of unifying marketing data and report creation is made as straightforward as taking a screenshot, yet it provides the capabilities of a comprehensive dashboard.
User Comments
Users appreciate the tool's ability to simplify the marketing reporting process.
They find the integration of data from various tools in one view very helpful.
The platform's ease of use and simplicity are frequently praised.
Some users highlight the attractive and shareable reports generated.
There is a general satisfaction with the time saved in report creation.
Traction
The specific metrics for Graphy's traction such as number of users, MRR/ARR, or financing are not available publicly. Information on platform updates or user base growth require further direct inquiry.
Market Size
The global market for marketing analytics was valued at $3.2 billion in 2021 and is expected to grow steadily.