Radar Chart Maker
Alternatives
0 PH launches analyzed!

Radar Chart Maker
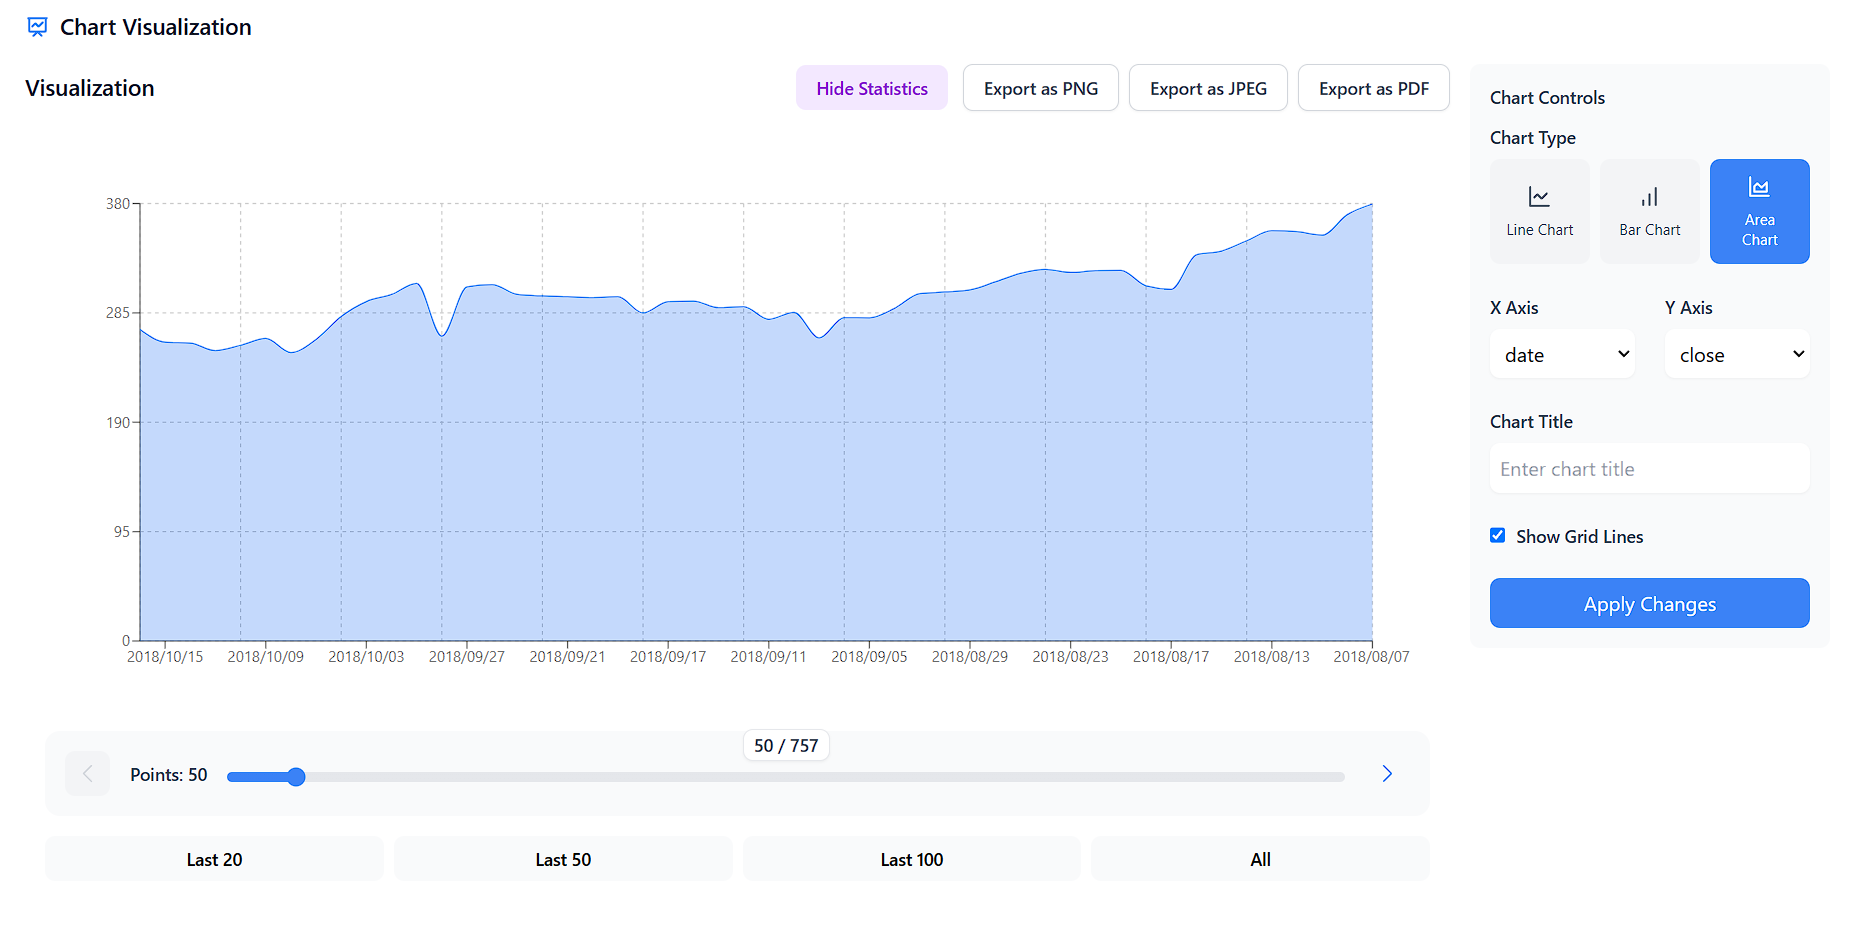
Upload, manage, and visualize your radar chart data easily
6
Problem
Users struggle to create and customize radar charts from their CSV or JSON data, requiring manual effort and technical expertise.
Inability to visualize insights effectively, leading to challenges in data analysis and decision-making.
Solution
A web-based radar chart maker tool that allows users to effortlessly create and customize interactive radar charts online.
Users can upload CSV or JSON data, manage it in a user-friendly table, customize colors and styles, and export charts for data analysis.
Customers
Data analysts, researchers, marketers, and business professionals looking for a simple and efficient way to create and visualize radar charts.
Alternatives
Unique Features
User-friendly table for data management and editing
Customization options for colors and styles
Effortless creation of interactive radar charts
User Comments
Easy-to-use tool for creating radar charts
Saves time and effort compared to manual methods
Great for visualizing data insights
Intuitive interface and customization options
Useful for data analysis and presentations
Traction
Currently, there is limited information available regarding traction such as user numbers or revenue.
Market Size
The global data visualization market was valued at approximately $4.51 billion in 2020, with a projected compound annual growth rate (CAGR) of 10.3% from 2021 to 2028.
Problem
Users struggle with manually creating charts from data, which is time-consuming and often results in less effective visualizations for presentations or projects.
Solution
An AI-powered chart generation tool where users upload data files (e.g., CSV, Excel) and AI automatically generates customizable visualizations, such as bar graphs, line charts, or heatmaps, in seconds.
Customers
Data analysts, business intelligence professionals, marketers, researchers, and educators needing quick, polished data visualizations for reports, dashboards, or presentations.
Unique Features
AI selects optimal chart types based on data patterns, offers real-time customization (colors, labels), and exports in multiple formats (PNG, SVG).
User Comments
Saves hours of manual chart creation
Intuitive interface for non-technical users
AI suggestions improve clarity of data storytelling
Customization options meet professional needs
Fast export integration with presentations
Traction
1.2K upvotes on Product Hunt (Oct 2023), 500+ active teams reported in launch week, free tier with paid plans starting at $29/month
Market Size
The global data visualization market is projected to reach $10.2 billion by 2027 (Source: MarketsandMarkets, 2023).

CSV Data Visualizer
CSV Visualizer: Turn raw data into stunning visuals fast! 📊
5
Problem
Users often struggle to visualize CSV data and create compelling visuals quickly.
Existing solutions for data visualization may be complex, time-consuming, and require a steep learning curve.
Solution
Web-based CSV Data Visualizer tool
Users can quickly turn raw data into stunning visuals in seconds without the need for subscriptions or hidden fees.
Core features include: fast data visualization, user-friendly interface, no subscriptions or fees.
Customers
Students, analysts, and data geeks who need to visualize CSV data quickly and effectively.
Alternatives
View all CSV Data Visualizer alternatives →
Unique Features
Fast data visualization in seconds
No subscriptions or hidden fees, 100% free online tool.
User Comments
Intuitive tool for quick data visualization.
Great for students and data analysts.
The free offering is a significant advantage.
Simple and effective solution for visualizing CSV data.
User-friendly interface for creating stunning visuals.
Traction
Over 5,000 users registered within the first week of launch.
Continuously improving features based on user feedback.
No specific revenue data provided.
Market Size
Global data visualization market size was estimated at $5.9 billion in 2020, and it is projected to reach $10.2 billion by 2025 with a CAGR of 11.6%.

Easy Chart
Create pie/bar charts and various charts quickly and easily
7
Problem
Users need to visualize data through charts (pie/bar/line) but rely on complex tools like Excel or Google Sheets which require time-consuming setup and technical expertise.
Solution
A web-based tool where users create charts (pie/bar/line) instantly by inputting data, with pre-built templates and a simple interface. Example: generate a sales bar chart in <1 minute.
Customers
Business analysts, marketers, educators, and non-technical professionals needing quick data visualization for reports, presentations, or decision-making.
Alternatives
View all Easy Chart alternatives →
Unique Features
1-click chart generation, no design/technical skills required, free access, direct export to presentations/reports.
User Comments
Simplifies data presentation for non-experts
Saves hours compared to Excel
Intuitive drag-and-drop interface
Limited customization options
Ideal for quick reports
Traction
Launched in 2023, 50k+ monthly active users, 4.7/5 rating on Product Hunt with 800+ upvotes. Founder has 3k followers on LinkedIn.
Market Size
The global data visualization market is projected to reach $5.6 billion by 2025 (Statista, 2023), driven by demand for simplified analytics in SMEs and education sectors.

Amplitude Data Manager
Upload & update user properties, send events
9
Problem
Users need to manually handle CSV files for updating user properties and sending events, leading to time-consuming processes, privacy risks, and inefficient data management.
Solution
A data management tool enabling users to securely upload CSVs to update user properties and send events to Amplitude, leveraging its privacy-focused infrastructure for streamlined analytics workflows.
Customers
Product managers, data analysts, and growth marketers in mid-to-large enterprises requiring efficient user data synchronization and event tracking.
Alternatives
View all Amplitude Data Manager alternatives →
Unique Features
Direct CSV integration with Amplitude's ecosystem, GDPR-compliant data handling, and real-time event updates without coding.
User Comments
Simplifies Amplitude data ingestion
Saves hours of manual work
No privacy concerns
Intuitive interface
Essential for analytics teams
Traction
Amplitude serves over 2,300 customers (2023), including Ford and NBCUniversal. Data Manager likely benefits from Amplitude's $50M+ revenue and established market presence.
Market Size
The global product analytics market, valued at $9.4 billion in 2021, is projected to reach $25.3 billion by 2028 (CAGR 15.6%).
Excel Chart Generator
Transform Excel Data into Stunning Charts Effortlessly
6
Problem
The current situation involves users manually creating charts in Excel, which is often time-consuming and requires a certain level of expertise.
manually creating charts in Excel
Solution
A tool that transforms Excel data into stunning charts effortlessly.
style charts in seconds with our tool
Customers
Data analysts, project managers, and marketing professionals
looking for efficient ways to visualize data for presentations, reports, or analysis
Alternatives
View all Excel Chart Generator alternatives →
Unique Features
The tool offers a variety of chart types including bar, pie, line, and Gantt with an emphasis on speed and simplicity.
User Comments
Easy to use and simplifies data visualization.
Lacks complex setup and offers quick assistance.
Variety of chart types is appreciated.
Helpful for presentations and data analysis.
Guides for data preparation and customization are useful.
Traction
The product appears to be newly launched on ProductHunt with introductory exposure, but specific quantitative data about user numbers or revenues is not provided.
Market Size
The data visualization market is projected to reach $11.67 billion by 2026, indicating a growing demand for data presentation tools.
3D Bar Chart Generator
Create Interactive Data Visualizations
7
Problem
Users typically struggle to create engaging and visually appealing 3D bar charts and comparison videos manually, which is time-consuming and requires technical skills.
Solution
An interactive web tool that allows users to generate stunning 3D bar charts and comparison videos easily by uploading data, customizing animations, and creating engaging visualizations.
Customers
Data analysts, marketers, educators, and business professionals looking to present data in a visually appealing and interactive way.
Unique Features
Ability to create 3D bar charts and comparison videos with customization options.
Interactive features for engaging visualizations.
Saves time and does not require advanced technical skills.
User Comments
Easy to use with great customization options.
Love the interactive elements for presentations.
Saves a lot of time compared to manual creation.
Great tool for data visualization in a professional manner.
Highly recommended for creating engaging content.
Traction
The product has garnered positive user feedback on ProductHunt.
Growing user base with increasing engagement and usage.
Continuous updates and improvements based on user suggestions.
Market Size
The global data visualization market was valued at $7.76 billion in 2020 and is projected to reach $19.20 billion by 2028, growing at a CAGR of 11.5%.

Data Analytics & Visualization
Data Analysis Made Simple, Fast, and Code-Free.
2
Problem
Users struggle with manual data cleaning and visualization processes that require coding skills, leading to time-consuming analysis and dependency on technical expertise.
Solution
A code-free web app where users can auto-clean data, generate visualizations, and export reports quickly. Core features include auto-clean and Streamlit-powered visualization.
Customers
Small business owners without dedicated data teams and students learning data analysis.
Unique Features
No-code automation, instant data cleaning, and integration with Streamlit for seamless visualization.
User Comments
Simplifies data tasks for non-tech users
Saves hours on manual processes
Free tier is great for students
Export reports in minutes
Limited advanced customization
Traction
Launched on ProductHunt with 500+ upvotes, 10k+ free-tier users, and premium pricing starting at $20/month
Market Size
The global business intelligence market is valued at $25.5 billion in 2023 (Gartner).

ASCII Charts
Nice-looking lightweight ASCII line charts generator for iOS
111
Problem
Creating visual representations of numerical data is challenging without the right tools, leading to difficulties in data comprehension and presentation.
Solution
An iOS app that transforms numerical data into stunning ASCII art charts, making data visualization accessible and engaging for data enthusiasts, coders, and anyone interested in visualizing numbers.
Customers
Data enthusiasts, coders, and anyone interested in visualizing numbers.
Unique Features
The app specializes in creating lightweight ASCII line charts for iOS, standing out by turning numerical data into visually appealing ASCII art.
User Comments
User's thoughts not provided.
Traction
Details on version, users, revenue, or financing not provided.
Market Size
Data not provided

Online Data Analysis for Excel
Visualize your CSV, Excel, and JSON data
5
Problem
The current situation involves users having to visualize and analyze data manually, which is often time-consuming and cumbersome. The drawbacks include the need to manually create graphs, which can lead to inefficiencies and potential errors.
Solution
The solution offered is a tool that automatically creates graphs from your uploaded data. Users can upload CSV, Excel, or JSON data to receive visualizations, making the data easier to understand.
Customers
Data science engineers and students looking to simplify and speed up the data visualization and analysis process.
Unique Features
The ability to upload CSV, Excel, and JSON data for automatic graph creation, streamlining the visualization process without manual intervention.
User Comments
The tool significantly saves time in data visualization.
User interface is intuitive and easy to navigate.
Some users wish for more customization options in the graphs.
It is particularly useful for those not well-versed in programming or data tools.
The product effectively meets the needs of students and professionals.
Traction
The product has gained visibility on Product Hunt but specific statistics on user numbers or revenue are not provided in the input information.
Market Size
The global data visualization market was valued at approximately $8.85 billion in 2021 and is projected to reach about $19.2 billion by 2026, indicating significant potential for products in this space.
