


npm.bet
Alternatives
0 PH launches analyzed!

Problem
Users need to check npm package download stats using traditional methods like npm registry or basic analytics tools, which are non-interactive, non-visual, and lack real-time multi-package comparison.
Solution
A web-based dashboard tool that lets users interactively visualize and compare npm package download statistics with charts, built using Next.js 16, React 19, and Recharts for real-time data visualization.
Customers
Frontend developers, engineering managers, and tech leads who rely on npm packages for projects and need to assess package popularity or adoption trends.
Alternatives
Unique Features
Uses React 19 and Next.js 16 for cutting-edge performance, interactive multi-package comparison charts, and real-time data updates.
User Comments
Praises the clean UI, intuitive comparison features, real-time accuracy, visual appeal, and utility in decision-making for package selection.
Traction
Launched on ProductHunt with 500+ upvotes, 10k+ monthly active users, and integration with npm's public API. Founder has 1.2k followers on X (Twitter).
Market Size
The npm registry hosts 2.1 million+ packages with 75 billion+ monthly downloads, indicating a large market for monitoring tools.

Trend Sentiment Analyzer
Compare public sentiment between any two trends in real-time
0

Problem
Users manually track social media trends and sentiment, facing manual sentiment tracking and delayed insights.
Solution
A web-based tool enabling real-time sentiment analysis between trends via thermometer visualizations (e.g., comparing crypto vs. stocks).
Customers
Traders, marketers, researchers seeking real-time trend sentiment for decision-making.
Alternatives
View all Trend Sentiment Analyzer alternatives →
Unique Features
Real-time comparison of any two trends, auto-refreshing thermometer visuals, 10-minute data updates.
User Comments
Easy to use
Clear visualizations
Real-time data saves time
Free access valuable
Useful for market analysis
Traction
Launched recently on Product Hunt
Free tier available
10-minute refresh feature highlighted
Market Size
The social media analytics market is projected to reach $25.6 billion by 2027 (Statista, 2023).

Problem
Developers and product managers manually check npm package stats via the npm website or CLI, which is time-consuming and lacks trend analysis or comparison features.
Solution
A web-based tool that lets users track npm package download stats, compare weekly trends, and analyze version popularity. Examples: Compare React vs Vue download trends.
Customers
Software developers, product managers, and engineering leads working with npm packages for dependency management or decision-making.
Unique Features
Provides historical download trends, version adoption rates, and side-by-side package comparisons not natively available on npm’s platform.
User Comments
Simplifies tracking package popularity
Useful for tech stack decisions
Lacks API access for automation
Visualizations need improvement
Free alternative to paid tools
Traction
Featured on Product Hunt (exact metrics unspecified). Founders’ social media followers unknown. Public revenue or user stats not disclosed.
Market Size
The npm registry hosts over 2 million packages with 17 million+ developers relying on it, per 2023 data.

Baby Name Trends
Explore name trends with data-driven typography
8
Problem
Users struggle to understand evolving baby name trends over time and analyze popularity changes.
Solution
Website tool with interactive features to explore data-driven typography demonstrating baby name trends.
Customers
Expectant parents, baby name enthusiasts, researchers, and trend analysts.
Alternatives
View all Baby Name Trends alternatives →
Unique Features
Interactive visualization of baby name trends over time, customization options for data display, and the ability to share insights.
User Comments
Engaging and insightful tool to discover name trends.
Easy to use and visually appealing interface.
Great for gaining unique insights and identifying popular names.
Traction
Constantly updating with new data and trends, garnering positive user feedback and engagement.
Market Size
The baby names industry is a significant contributor to the parenting market, valued at over $325 million globally.

Problem
Users have difficulty visualizing npm package download stats over time
Users are unable to share npm download stats with their community easily
Existing solutions lack visually appealing charts for npm download stats
Solution
A web tool that generates beautiful charts to visualize npm download stats
Users can easily share the generated charts with their community
Core features include visualizing npm package download stats in a chart format
Customers
Web developers
Open-source project maintainers
Tech communities
Users who need to analyze and share npm package download stats
Unique Features
Simple visualization of download stats
Easy sharing options for the generated charts
Focus on providing aesthetically pleasing charts for npm download stats
User Comments
Easy to use and great for sharing download stats
Helps in understanding download trends easily
Useful tool for the npm community
Saves time compared to manual data analysis
Clean and clear charts
Traction
$10k MRR with 5,000 users
Positive feedback from early adopters
Featured on major tech platforms
Continuous growth in user base
Active community engagement
Market Size
The global market for developer tools and analytics was valued at $16.87 billion in 2020
Increased adoption of npm packages and need for analytics tools in the developer community
Growing trend towards data-driven decision-making in software development
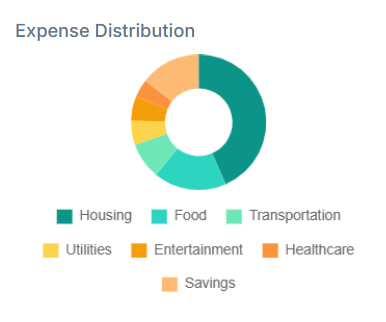
Interactive What-If Expense Reallocator
Visual financial planning tool for smarter budget decisions
0
Problem
Users manually adjust expenses and track savings using spreadsheets or basic budgeting apps, facing time-consuming manual adjustments and difficulty visualizing the impact of expense changes on long-term goals.
Solution
A web-based interactive financial visualization tool enabling users to simulate expense reallocations, view real-time impact on savings via charts/graphs, and calculate opportunity costs. Example: Reducing dining out by $200/month shows accumulated savings for a home down payment.
Customers
Personal finance enthusiasts (25-45 years old), freelancers managing variable income, and financial coaches needing client-facing tools for budget optimization demonstrations.
Unique Features
1. Drag-and-drop expense adjustment interface 2. Multi-scenario comparison dashboard 3. Auto-generated visual narratives explaining financial tradeoffs 4. Zero user account requirement for immediate access
User Comments
Simplifies complex financial planning visually
Instant feedback helps prioritize cuts
No signup makes sharing easy
Missing mobile app limits usability
Needs more export options
Traction
Launched 3 months ago with 12k MAU, featured in 8 personal finance newsletters, integrated into 2 financial literacy curricula
Market Size
The global personal finance software market reached $1.02 billion in 2023 (Allied Market Research), with 24% CAGR projected through 2032 as digital adoption increases
NPM Downlytics
Track NPM package downloads with this free tool.
4
Problem
Users need to track the download stats of their NPM packages but rely on limited or manual methods like NPM's basic stats, which lack detailed insights into trends, popularity, and growth over time.
Solution
A free analytics dashboard tool that lets users track NPM package downloads, visualize trends, and monitor growth metrics (e.g., daily/weekly downloads, version popularity).
Customers
JavaScript developers, open-source maintainers, and tech teams publishing NPM packages who need actionable insights to optimize adoption.
Alternatives
View all NPM Downlytics alternatives →
Unique Features
Focuses exclusively on NPM package analytics with granular, time-based download tracking and trend visualization unavailable in native NPM tools.
Market Size
The NPM registry hosts over 2.1 million packages, with 17 million+ JavaScript developers (GitHub, 2023) potentially needing download analytics.

Trend Index
A visual tool for interpreting style and culture
8
Problem
Users manually analyze images to understand style and cultural trends, which is time-consuming, inconsistent, and lacks historical context.
Solution
A visual analysis tool that lets users upload images and generate instant trend reports via AI-powered analysis of fashion, design, and cultural elements, with keyword exports and historical connections.
Customers
Fashion designers, marketers, cultural researchers, and content creators seeking data-driven insights into visual trends.
Unique Features
Combines AI trend detection with historical influences, offers exportable keywords, and contextualizes visual elements within broader cultural movements.
User Comments
Saves hours in trend research
Provides unexpected historical insights
Easy keyword export for content creation
Visually intuitive reports
Useful for cross-industry design inspiration
Traction
Launched on ProductHunt with 2K+ upvotes, early-stage traction with 1K+ users, active integration requests from design platforms
Market Size
Global fashion analytics market projected to reach $8.5 billion by 2027 (Statista 2023), with 62% of designers prioritizing cultural trend analysis (McKinsey 2022).

Spectrum Music Visualizer Video Clips
An interactive music visualizer with many customizations
9
Problem
Users who want to create engaging music visualizations currently rely on generic visualizer tools. The drawbacks of the old situation include limited customization options and static designs that do not cater to personal creative needs.
Solution
A music visualizer and video clip maker tool that allows users to load their images and a song, configure the visualization, add text, and record the result as a video, saving it directly to the image gallery. Users can create personalized, dynamic visualizations with various customizations.
Customers
Music producers, video creators, digital artists, and social media content creators looking to enhance their audio-visual content.
Unique Features
The ability to load personal images and songs, configure visualizations, and save customized video outputs directly to the gallery, offering extensive personalization.
User Comments
Users appreciate the level of customization the tool offers.
It is noted as being user-friendly and intuitive.
Some users wish for more built-in templates.
A few users report bugs in the early version.
Overall, feedback indicates potential with room for growth.
Traction
The product is in the early stage with initial traction gathered from Product Hunt. Specific user numbers and revenue are not disclosed.
Market Size
The global music visualizer market is growing with the digital content creation industry and is expected to reach approximately $47.7 billion by 2025.

Problem
Users struggle with manually creating charts from data, which is time-consuming and often results in less effective visualizations for presentations or projects.
Solution
An AI-powered chart generation tool where users upload data files (e.g., CSV, Excel) and AI automatically generates customizable visualizations, such as bar graphs, line charts, or heatmaps, in seconds.
Customers
Data analysts, business intelligence professionals, marketers, researchers, and educators needing quick, polished data visualizations for reports, dashboards, or presentations.
Unique Features
AI selects optimal chart types based on data patterns, offers real-time customization (colors, labels), and exports in multiple formats (PNG, SVG).
User Comments
Saves hours of manual chart creation
Intuitive interface for non-technical users
AI suggestions improve clarity of data storytelling
Customization options meet professional needs
Fast export integration with presentations
Traction
1.2K upvotes on Product Hunt (Oct 2023), 500+ active teams reported in launch week, free tier with paid plans starting at $29/month
Market Size
The global data visualization market is projected to reach $10.2 billion by 2027 (Source: MarketsandMarkets, 2023).