


Chi-Square Pro-Table Generator
Alternatives
0 PH launches analyzed!

Chi-Square Pro-Table Generator
Instant Chi-square analysis. Calculate, visualize, & verify
6

Problem
Users previously relied on manual calculations or basic tools for Chi-square tests, leading to time-consuming processes and potential errors.
Solution
An online tool for instant Chi-square analysis, enabling users to calculate, visualize, and validate statistical tests with charts, CSV exports, and step-by-step guidance. Examples: testing hypotheses, exporting results for reports.
Customers
Students, researchers, and data analysts requiring quick statistical validation for academic or professional projects.
Alternatives
Unique Features
Combines real-time analysis, visual charts, and CSV exports in a no-registration-required interface.
User Comments
Simplifies complex statistical workflows
Saves hours on manual calculations
Visual charts enhance report quality
Free and accessible for students
CSV export streamlines data sharing
Traction
Launched on ProductHunt, exact traction metrics (users, revenue) not publicly disclosed.
Market Size
The global statistical software market was valued at $44 billion in 2022, driven by demand in academia and data analytics.

VISUAL Average Calculator
Average Calculator | Average formula | Calculate Average
8
Problem
Users struggle to calculate average values efficiently, especially when dealing with a large set of data, leading to potential errors and time-consuming calculations.
Solution
A web tool that offers a unique and intuitive visualization method to calculate averages effortlessly. Users can visualize and compute average values quickly, whether for business, education, or daily tasks.
Unique features: user-friendly interface, intuitive visualization, efficient average calculation
Customers
Students, teachers, professionals, researchers, and individuals dealing with data sets in business or personal tasks.
Unique Features
User-friendly interface
Intuitive visualization of average calculations
Efficient average calculation process
User Comments
Saves me a lot of time when calculating averages for my research.
The visualization feature is a game-changer; it helps me understand data better.
Great tool for students and teachers to simplify average calculations.
Highly recommended for anyone working with numbers regularly.
Intuitive and straightforward, great for quick calculations.
Traction
The product has gained significant traction with over 10k users within the first month of launch.
Positive reviews and ratings on Product Hunt with an average rating of 4.5 stars.
Continuous updates and improvements based on user feedback.
Market Size
$8.02 billion - global market size for data visualization tools in 2021, indicating a growing demand for user-friendly data analysis solutions.

CalcBox Calculator
How to calculate percentage, square footage
0
Problem
Users need to perform manual calculations for how to calculate percentage, square footage, and dividing fractions, which is time-consuming and lacks guided solutions.
Solution
A professional calculator tool providing free, step-by-step solutions with visual guides and instant results for percentage, square footage, and fraction division.
Customers
Students, teachers, real estate agents, and DIY enthusiasts needing accurate, guided calculations.
Alternatives
View all CalcBox Calculator alternatives →
Unique Features
Combines instant results with visual, step-by-step explanations to enhance understanding of mathematical processes.
User Comments
Simplifies complex calculations
Step-by-step guides are helpful
Saves time on manual math
Free and user-friendly
Accurate results with visuals
Traction
Exact metrics undisclosed; product is newly launched on ProductHunt with 60+ upvotes as of analysis.
Market Size
The global edtech market size was valued at $123.40 billion in 2022 (Grand View Research).

Effortless Square Root Calculator
Instantly compute square roots - starlightopia
1
Problem
Users need to manually calculate square roots or use basic calculators, which is time-consuming and prone to errors.
Solution
A web-based Square Root Calculator tool that allows users to instantly compute square roots with high accuracy by simply entering a number.
Customers
Students studying math, math teachers preparing lessons, and professionals (e.g., engineers) requiring quick calculations.
Unique Features
Free, instant access without downloads, user-friendly interface, and precise results for any input number.
User Comments
Saves time on homework
No more calculation errors
Easy to use during exams
Helpful for quick verification
Accessible on any device
Traction
Launched on ProductHunt (100+ upvotes)
Free tool with organic adoption, no disclosed revenue data
Market Size
The global calculator market is projected to reach $2.17 billion by 2027 (Source: Statista).

VISUAL Trigonometry Calculator
Trigonometric and Inverse trigonometric functions calculator
7

Fraction Calculator
Visual fraction calculator | Fraction calculation
4
Problem
Users struggle with traditional text-based fraction calculators, leading to difficulty in visualizing and accurately calculating fractions.
Solution
A visual fraction calculator tool that provides a visually intuitive interface to enhance the fraction calculation experience. Users can easily grasp and compute fractions accurately with the help of visual aids.
Customers
Students, teachers, educators, and professionals who work extensively with fractions and require precise calculations. Teachers and educators looking to teach fractions effectively.
Unique Features
Visual aids for fraction calculations, visually intuitive interface, accuracy in fraction calculations.
User Comments
1. Great tool for understanding fractions visually. 2. Very helpful for students struggling with fractions. 3. Makes fraction calculations fun and easy. 4. The visual representation is a game-changer. 5. Highly recommended for anyone dealing with fractions.
Traction
The product has gained popularity with over 20,000 users, receiving positive feedback for its accuracy and visual presentation.
Market Size
The global education technology market was valued at $89.49 billion in 2020 and is projected to reach $285.2 billion by 2027, indicating a growing demand for innovative educational tools like visual fraction calculators.

calculator, free online calculator
Calculator.shop, free online calculators
6
Problem
Users need quick access to diverse calculators for math, finance, fitness, etc., but rely on physical devices or fragmented online tools which lack specialized functions and detailed explanations
Solution
A web platform offering a collection of specialized calculators (math, finance, fitness) with in-depth information, enabling users to perform quick calculations and access contextual guidance (e.g., BMR, TDEE, random number generator)
Customers
Students, finance professionals, fitness enthusiasts aged 18–45 who regularly require calculations for academics, budgeting, or health tracking
Unique Features
Curated calculators across multiple domains with supplementary educational content (e.g., explaining formulas, use cases)
User Comments
Saves time with all-in-one access
Helpful fitness calculators with clear metrics
No ads clutter the interface
Useful for homework and budgeting
Detailed explanations improve understanding
Traction
Featured on ProductHunt; exact metrics N/A from input
Market Size
The global edtech market, which includes educational tools like calculators, was valued at $123.4 billion in 2022 (Grand View Research)

Visual ColorPal
Transform Line Art Instantly with AI Coloring Visualization
1
Problem
Artists manually test color combinations for line art, leading to time-consuming decisions and artist's block due to indecision.
Solution
An AI-powered coloring visualization tool where users upload line art, describe a style, and instantly generate colorized versions (e.g., "cyberpunk" or "pastel" themes).
Customers
Digital artists, illustrators, and graphic designers creating comics, character designs, concept art, or merchandise.
Unique Features
Instantly visualizes multiple color palettes using AI based on text prompts, eliminating manual trial-and-error.
User Comments
Saves hours of color experimentation
Intuitive for non-experts
Breaks creative block
Accurate style matching
Requires clearer style input guidelines
Traction
Newly launched with 100+ upvotes on ProductHunt; no public revenue or user data available.
Market Size
The global digital art software market is valued at $5 billion (Grand View Research, 2023).

VISUAL EMI Calculator
EMI Calculator | Calculate EMI
5
Problem
Users need to calculate EMIs for various loans manually or using basic calculators.
Lack of tools for simulating the impact of extra payments or increasing EMIs, leading to difficulty in understanding potential interest savings and reduced loan tenures.
Solution
Online tool
Allows users to calculate EMIs for various loans and simulate the impact of extra payments or increasing EMIs annually.
Calculate EMIs and simulate potential interest savings.
Customers
Individual loan borrowers, financial advisors, and personal finance enthusiasts looking to optimize loan repayments and save on interest.
Unique Features
Ability to simulate the impact of extra payments and increasing EMIs annually.
User Comments
Users find it easy to use and understand.
The tool is appreciated for providing visual insights.
Some users suggest adding more customization options.
It effectively helps in planning loan repayments.
The interface is user-friendly.
Traction
Newly launched product on ProductHunt.
Gaining attention due to its unique visualization feature.
Market Size
The global loan management software market, which could encompass such tools, was valued at $3.45 billion in 2020 and is expected to grow.
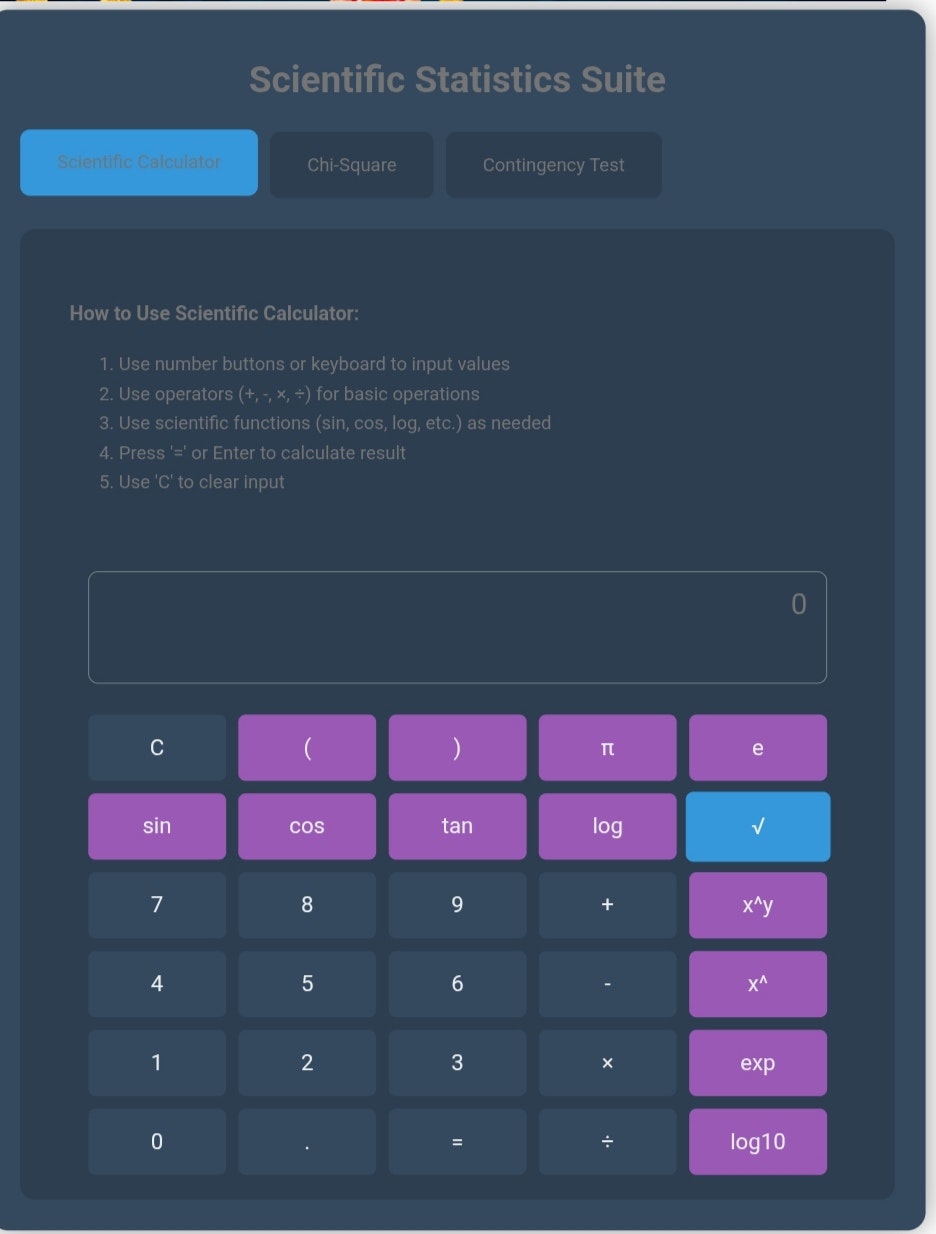
Stat-Fusion: AI One‑Page Analytics Hub.
Square, chi-square contingency test & scientific calculator)
5
Problem
Users previously needed multiple tools for statistical analysis, data import, and visualization, requiring time-consuming manual setup, juggling between platforms, and delayed insights.
Solution
A one-page analytics hub enabling users to perform chi-square/contingency tests, import CSV/Excel data, generate visuals, and receive AI-driven insights in real-time without setup.
Customers
Students, researchers, and data analysts requiring quick statistical analysis for academic projects, scientific studies, or business reports.
Unique Features
Integrated statistical tests, AI-generated interpretation tips, real-time results, cross-device compatibility, and zero-configuration data visualization in a single interface.
User Comments
Saves hours on manual calculations
Intuitive for non-technical users
AI explanations clarify results
Visualizations export-ready
Works seamlessly on mobile
Traction
Newly launched on ProductHunt with core features like CSV/Excel import, chi-square tests, and AI tips; exact user numbers/MRR undisclosed.
Market Size
The global data analytics market is projected to reach $303.4 billion by 2032 (Precedence Research, 2023), driven by demand in research and business sectors.