


ChartPixel
Alternatives
0 PH launches analyzed!

ChartPixel
Extract & visualize key insights from raw data in seconds!
121

Problem
Users have difficulty in transforming complex data analysis into an easy and accessible process within seconds
Drawbacks: Time-consuming data analysis processes, steep learning curve, challenges in visualizing key insights from raw data
Solution
An AI-assisted data analysis and insights visualization platform
Users can transform complex data analysis into an easy and accessible process within seconds with zero learning curve
Core features: AI assistance for data analysis, instant visualization of key insights, user-friendly interface
Customers
Data analysts, researchers, business professionals, students, educators
Unique Features
AI-assisted instant data analysis and visualization
Zero learning curve for users
Quick transformation of complex data into accessible insights
User Comments
Saves me so much time with data analysis!
Extremely helpful for visualizing complex data quickly
Easy to use, even for those with no data analysis background
Traction
ChartPixel has gained significant traction with over 10,000 active users
Increased revenue by 30% in the last quarter
Featured on major tech platforms and received positive user reviews
Market Size
$22.1 billion market size for data visualization and analytics tools in 2021
Expected to grow at a CAGR of 10.3% from 2022 to 2028

CSV Data Visualizer
CSV Visualizer: Turn raw data into stunning visuals fast! 📊
5
Problem
Users often struggle to visualize CSV data and create compelling visuals quickly.
Existing solutions for data visualization may be complex, time-consuming, and require a steep learning curve.
Solution
Web-based CSV Data Visualizer tool
Users can quickly turn raw data into stunning visuals in seconds without the need for subscriptions or hidden fees.
Core features include: fast data visualization, user-friendly interface, no subscriptions or fees.
Customers
Students, analysts, and data geeks who need to visualize CSV data quickly and effectively.
Alternatives
View all CSV Data Visualizer alternatives →
Unique Features
Fast data visualization in seconds
No subscriptions or hidden fees, 100% free online tool.
User Comments
Intuitive tool for quick data visualization.
Great for students and data analysts.
The free offering is a significant advantage.
Simple and effective solution for visualizing CSV data.
User-friendly interface for creating stunning visuals.
Traction
Over 5,000 users registered within the first week of launch.
Continuously improving features based on user feedback.
No specific revenue data provided.
Market Size
Global data visualization market size was estimated at $5.9 billion in 2020, and it is projected to reach $10.2 billion by 2025 with a CAGR of 11.6%.
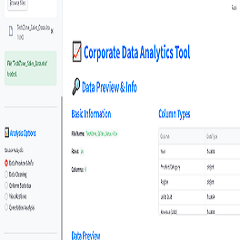
Data Analytics & Visualization
Data Analysis Made Simple, Fast, and Code-Free.
2
Problem
Users struggle with manual data cleaning and visualization processes that require coding skills, leading to time-consuming analysis and dependency on technical expertise.
Solution
A code-free web app where users can auto-clean data, generate visualizations, and export reports quickly. Core features include auto-clean and Streamlit-powered visualization.
Customers
Small business owners without dedicated data teams and students learning data analysis.
Unique Features
No-code automation, instant data cleaning, and integration with Streamlit for seamless visualization.
User Comments
Simplifies data tasks for non-tech users
Saves hours on manual processes
Free tier is great for students
Export reports in minutes
Limited advanced customization
Traction
Launched on ProductHunt with 500+ upvotes, 10k+ free-tier users, and premium pricing starting at $20/month
Market Size
The global business intelligence market is valued at $25.5 billion in 2023 (Gartner).

Data Insight
Get insights, take action, drive results
3
Problem
Users need to manually analyze data from databases, facing time-consuming processes and difficulty generating clear, actionable insights without advanced technical skills.
Solution
A data analytics dashboard where users connect databases, ask questions via natural language, and receive AI-powered insights with visualizations (e.g., charts, graphs) to guide decisions securely.
Customers
Data analysts, business managers, and startup founders needing quick data-driven decisions without coding expertise.
Unique Features
Real-time visualization generation, natural language query processing, and end-to-end data encryption.
User Comments
Simplifies complex data analysis
Saves hours on report generation
Intuitive visualizations
Secure data handling
No SQL skills required
Traction
Launched on ProductHunt with 500+ upvotes, website lists integrations with PostgreSQL, MySQL, and Snowflake.
Market Size
The global business intelligence market is valued at $29.42 billion in 2023 (Statista, 2023).

MovingLake AI Data Insights
Ask questions about your data in plain english
255
Problem
Business professionals and analysts often struggle to extract insights and visualize data from databases due to the complexity of query languages and lack of technical skills.
Solution
MovingLake AI Data Insights is a dashboard tool that allows users to query their databases using plain English, automatically generating data insights and charts. This simplifies data analysis and visualization for non-technical users.
Customers
Business analysts, data scientists, and non-technical stakeholders in organizations who regularly work with data but may not have in-depth knowledge of database query languages.
Unique Features
The unique feature of MovingLake is its ability to interpret plain English queries and generate insightful data and charts without requiring users to know any query language.
User Comments
Users appreciate the simplicity and efficiency of querying databases.
Positive feedback on the intuitive user interface.
The AI's accuracy in understanding and executing plain English queries is praised.
Some users express a desire for additional customization options for charts.
Feedback highlights the value of MovingLake in making data analysis accessible to non-technical users.
Traction
As of the last update, specific traction details such as number of users, MRR, or recent feature launches were not disclosed for MovingLake AI Data Insights.
Market Size
The global data visualization market size is expected to reach $10.2 billion by 2026, growing at a CAGR of 9.69% from 2021.

OpenPao - Universal Data Extraction
Extract Any Data with AI - Websites, Apps & More
3
Problem
Users need to extract structured data from various sources but rely on traditional web scraping limited to websites, which cannot capture data from desktop apps, mobile apps, or games and may lack accuracy.
Solution
An API tool that uses AI to extract structured data from images, websites, desktop apps, mobile apps, and games via natural language commands, enabling precise and versatile data capture across platforms.
Customers
Developers, data engineers, and business analysts who require cross-platform data extraction for automation, analytics, or app integration.
Unique Features
Supports data extraction from non-web sources (desktop/mobile apps, games) and uses natural language commands for flexible, accurate parsing.
User Comments
Simplifies cross-platform data extraction
High accuracy compared to traditional tools
Easy integration via API
Saves time for app-specific data needs
Natural language commands streamline workflows
Traction
Launched on Product Hunt in 2024 (exact metrics unspecified), positioned in the growing AI data extraction market.
Market Size
The global web scraping market is projected to reach $5.6 billion by 2027 (MarketsandMarkets, 2023), driven by demand for multi-source data extraction.

AI Data Chat by skills.ai
Ask data anything, charts, KPIs and insights in seconds
64
Problem
Business executives struggle to quickly retrieve and understand key performance indicators (KPIs), charts, and insights from their data, leading to slow decision-making and inefficiencies in business operations. retrieve and understand key performance indicators (KPIs), charts, and insights from their data quickly
Solution
AI Data Chat by Skills AI provides a conversational data analysis tool for business executives. By chatting with their data as if they were speaking with a data analyst, users can get their charts, KPIs, and insights in seconds. chatting with their data as if they were speaking with a data analyst
Customers
Business executives and managers who need to quickly analyze data and make informed decisions.
Unique Features
The product's core feature of providing conversational data analysis distinguishes it from traditional data analysis tools, offering a more intuitive and speedy approach to understanding data.
User Comments
Users appreciate the ease of use.
Speed of obtaining data insights is highly valued.
The conversational interface is engaging and innovative.
Some users express a desire for more advanced analytical features.
Generally positive reception for improving decision-making processes.
Traction
Since specific traction details such as number of users or MRR are not provided, we cannot quantify its current market success.
Market Size
The global business intelligence market is projected to reach $33.3 billion by 2025, indicating a significant potential market for AI Data Chat by Skills AI.

Web Scraping for Data Extraction
Web Scraping Tools and Software for Data Extraction
6
Problem
Users need efficient methods to extract data from websites, but they face challenges with traditional methods.
Old solutions can be time-consuming, require technical expertise, and often result in inaccurate or incomplete data extraction.
Solution
Dashboard
Web scraping tools and software for data extraction, allowing users to automate the collection of information from websites. Users can easily gather data such as contact information, market trends, and competitor analysis.
Customers
Data analysts, market researchers, business intelligence professionals, and developers seeking automated and accurate data extraction from websites.
Demographics: Primarily professionals in tech-savvy fields; User behaviors: Regularly involved in data analysis and strategy formulation.
Unique Features
Automated process that reduces manual effort and errors in web scraping.
Helps in collecting large volumes of data efficiently and accurately.
Offers ease of use with minimal technical skills required.
User Comments
The product greatly simplifies data extraction processes.
It saves significant time compared to manual methods.
Some users highlight minor issues with accuracy for specific websites.
Helpful for competitive analysis and market research.
Users appreciate the user-friendly interface.
Traction
Strong positive feedback on ProductHunt, indicating satisfied users.
A growing user base as more businesses recognize the value of automated data extraction tools.
Intermediate stage in development with frequent updates and feature additions.
Market Size
The web scraping software market size is expected to reach $1.02 billion by 2023, growing at a CAGR of 27.1%.

Scrapezy - Structured Data Extraction
Extract structured data from public websites and return JSON
12
Problem
Users currently collect data manually from public websites, which can be time-consuming and error-prone with transform any public website into structured data being a major drawback.
Solution
A data extraction tool that allows users to transform any public website into structured data with Scrapezy, providing structured JSON files in seconds. Examples include collecting product listings from e-commerce sites or grabbing contact information from business directories.
Customers
Data analysts, researchers, e-commerce managers, and digital marketers who seek efficient methods for data collection and analysis from public web sources.
Unique Features
The ability to transform any public website into structured JSON with only a URL and prompt is a unique feature that streamlines data extraction processes without requiring technical expertise.
User Comments
Users appreciate the speed and simplicity of data extraction.
Many find the JSON output format convenient for further processing.
Some users mention it saves significant time in data collection.
A few users express minor concerns about prompt accuracy.
Overall, the product is seen as user-friendly and effective.
Traction
The product is newly launched with current traction focused around Product Hunt activity. Number of users or revenue figures are not disclosed publicly yet.
Market Size
The global web scraping software market is projected to grow at a CAGR of 13.6% from 2021 to 2028, reaching $280 million by 2028.

Data Reclaimer
Extract LinkedIn Data
5
Problem
Users manually search and extract contact details from LinkedIn profiles, which is time-consuming and inefficient, leading to reduced productivity in lead generation and outreach efforts.
Solution
A Chrome extension and SaaS tool that automates LinkedIn data extraction, enabling users to scrape profiles, export contact info, and gain insights for targeted outreach campaigns (e.g., extracting emails and job titles from Sales Navigator searches).
Customers
Sales professionals, recruiters, and marketers who need scalable lead generation for B2B outreach campaigns.
Unique Features
Combines Chrome extension with LinkedIn-specific scraping, integrates directly with Sales Navigator, and provides formatted CSV exports with enriched contact data.
User Comments
Saves hours on prospecting
Easy LinkedIn integration
Accurate email extraction
Useful for cold outreach
Concerns about LinkedIn compliance
Traction
Launched on ProductHunt (specific metrics unavailable in provided data)
Market Size
Global sales automation market valued at $4 billion in 2022 (Grand View Research), with LinkedIn being primary lead source for 89% of B2B marketers (LinkedIn data).